To add geospatial analysis to your ride count visualization, you need geospatial data to work out which trips originated where. As $TIMESCALE_DB is compatible with all $PG extensions, use PostGIS to slice data by time and location.
-
Connect to your $SERVICE_LONG and add the PostGIS extension:
CREATE EXTENSION postgis;
-
Add geometry columns for pick up and drop off locations:
ALTER TABLE rides ADD COLUMN pickup_geom geometry(POINT,2163);
ALTER TABLE rides ADD COLUMN dropoff_geom geometry(POINT,2163);
-
Convert the latitude and longitude points into geometry coordinates that work with PostGIS:
UPDATE rides SET pickup_geom = ST_Transform(ST_SetSRID(ST_MakePoint(pickup_longitude,pickup_latitude),4326),2163),
   dropoff_geom = ST_Transform(ST_SetSRID(ST_MakePoint(dropoff_longitude,dropoff_latitude),4326),2163);
This updates 10,906,860 rows of data on both columns, it takes a while. Coffee is your friend.
You might run into this error while the update happens
Error: tuple decompression limit exceeded by operation Error Code: 53400 Details: current limit: 100000, tuples decompressed: 10906860 Hint: Consider increasing timescaledb.max_tuples_decompressed_per_dml_transaction or set to 0 (unlimited).To fix this, use
SET timescaledb.max_tuples_decompressed_per_dml_transaction TO 0;
In this section you visualize a query that returns rides longer than 5 miles for
trips taken within 2 km of Times Square. The data includes the distance travelled and
is GROUP BY trip_distance and location so that Grafana can plot the data properly.
This enables you to see where a taxi driver is most likely to pick up a passenger who wants a longer ride, and make more money.
-
Create a geolocalization dashboard
-
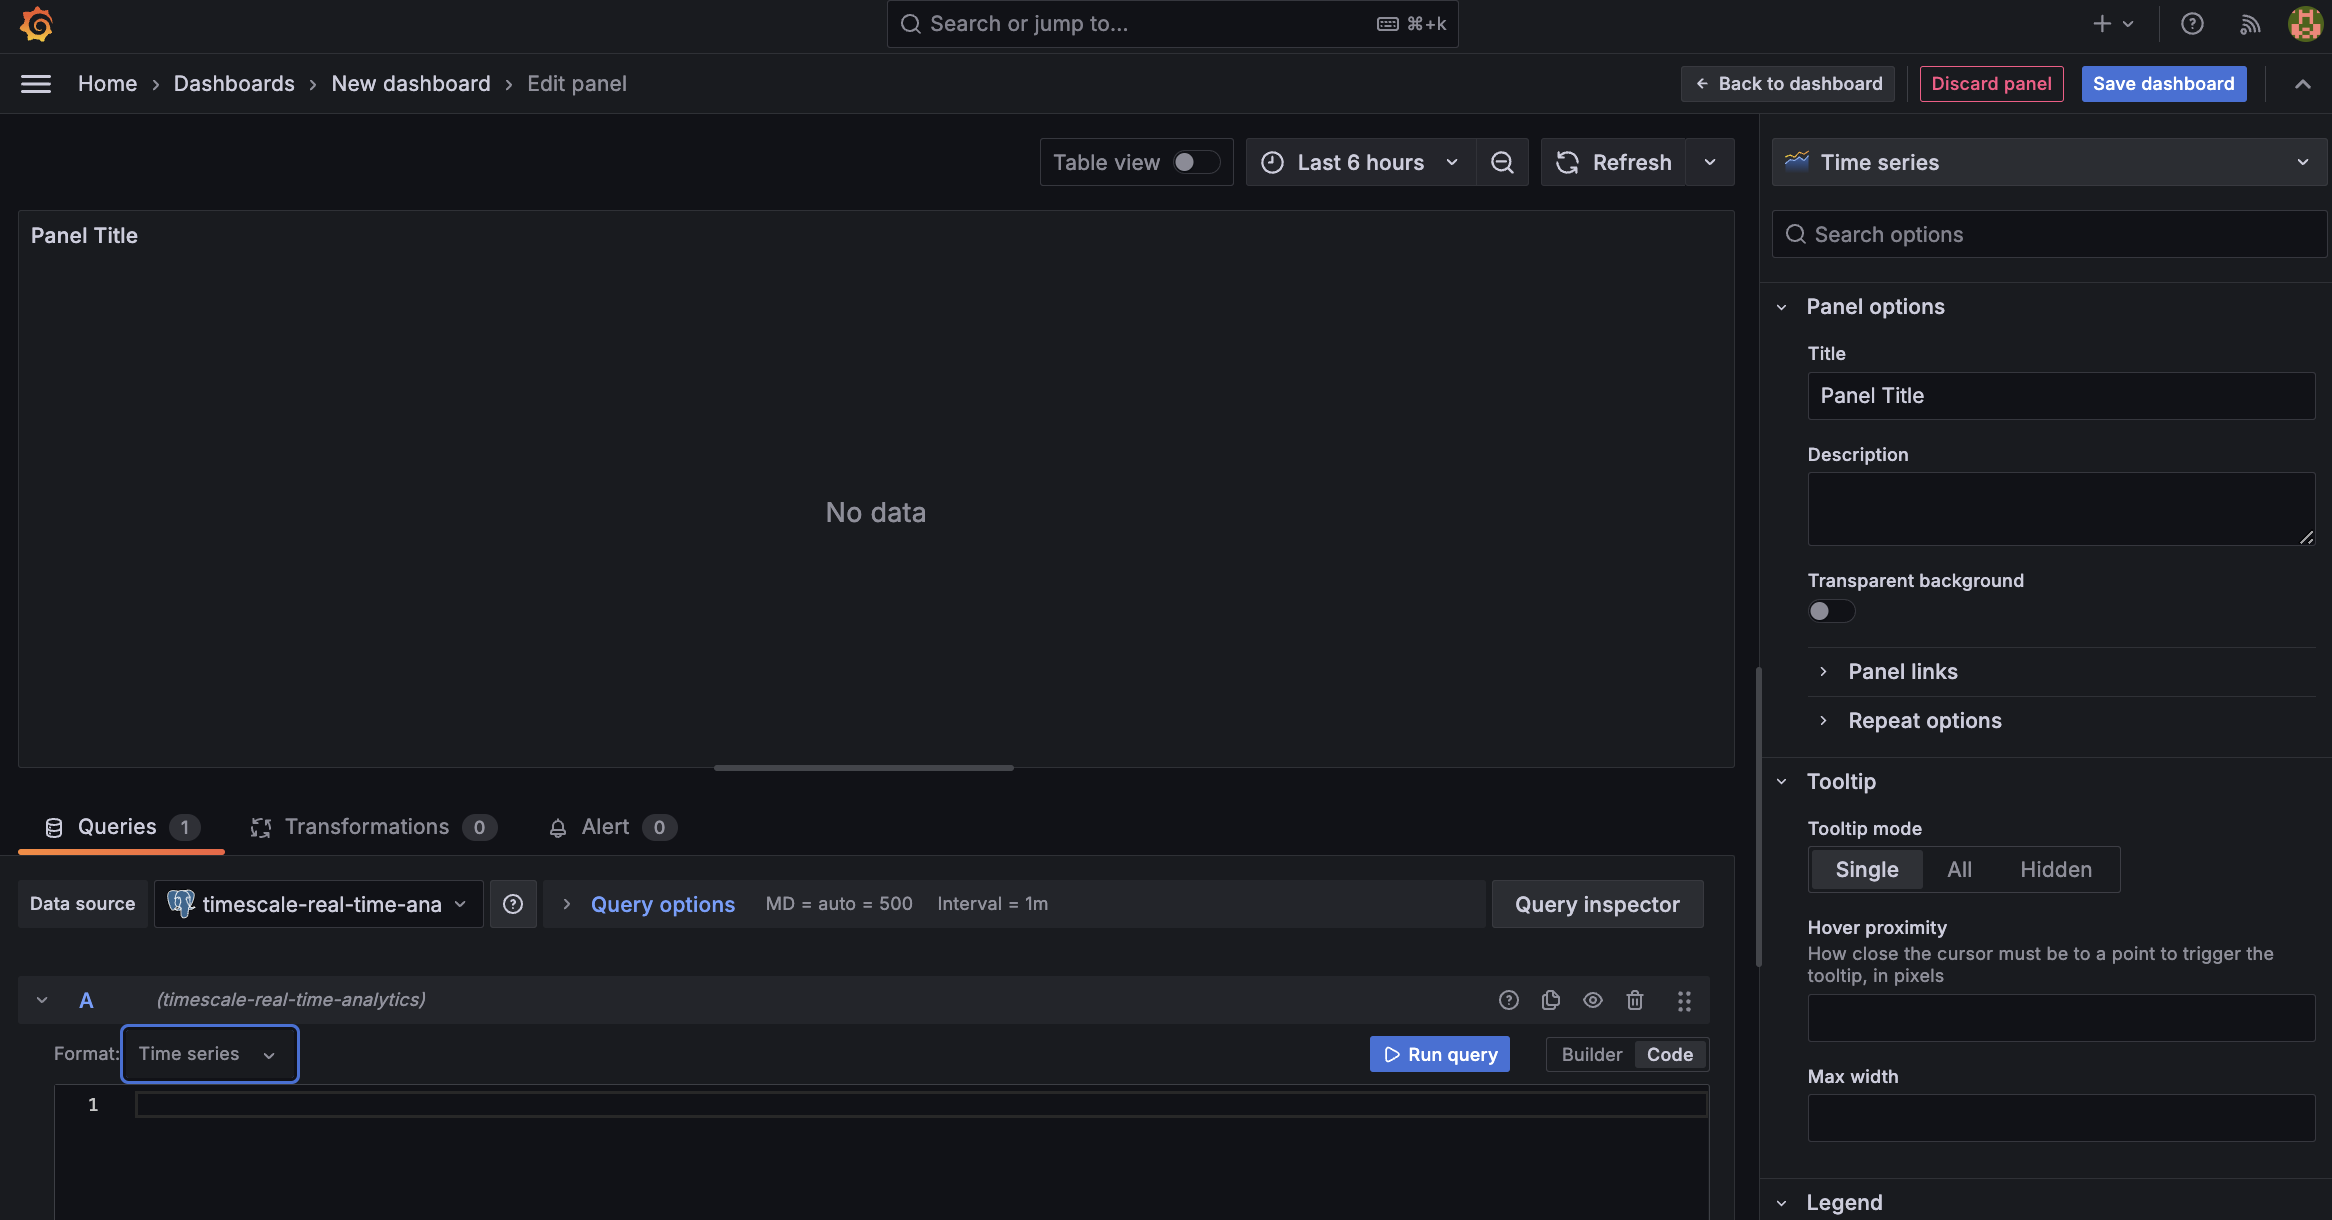
In Grafana, create a new dashboard that is connected to your $SERVICE_LONG data source with a Geomap visualization.
-
In the
Queriessection, selectCode, then select the Time seriesFormat. -
To find rides longer than 5 miles in Manhattan, paste the following query:
SELECT time_bucket('5m', rides.pickup_datetime) AS time,
       rides.trip_distance AS value,
       rides.pickup_latitude AS latitude,
       rides.pickup_longitude AS longitude
FROM rides
WHERE rides.pickup_datetime BETWEEN '2016-01-01T01:41:55.986Z' AND '2016-01-01T07:41:55.986Z' AND
  ST_Distance(pickup_geom,
              ST_Transform(ST_SetSRID(ST_MakePoint(-73.9851,40.7589),4326),2163)
  ) < 2000
GROUP BY time,
         rides.trip_distance,
         rides.pickup_latitude,
         rides.pickup_longitude
ORDER BY time
LIMIT 500;
You see a world map with a dot on New York.
-
Zoom into your map to see the visualization clearly.
-
-
Customize the visualization
-
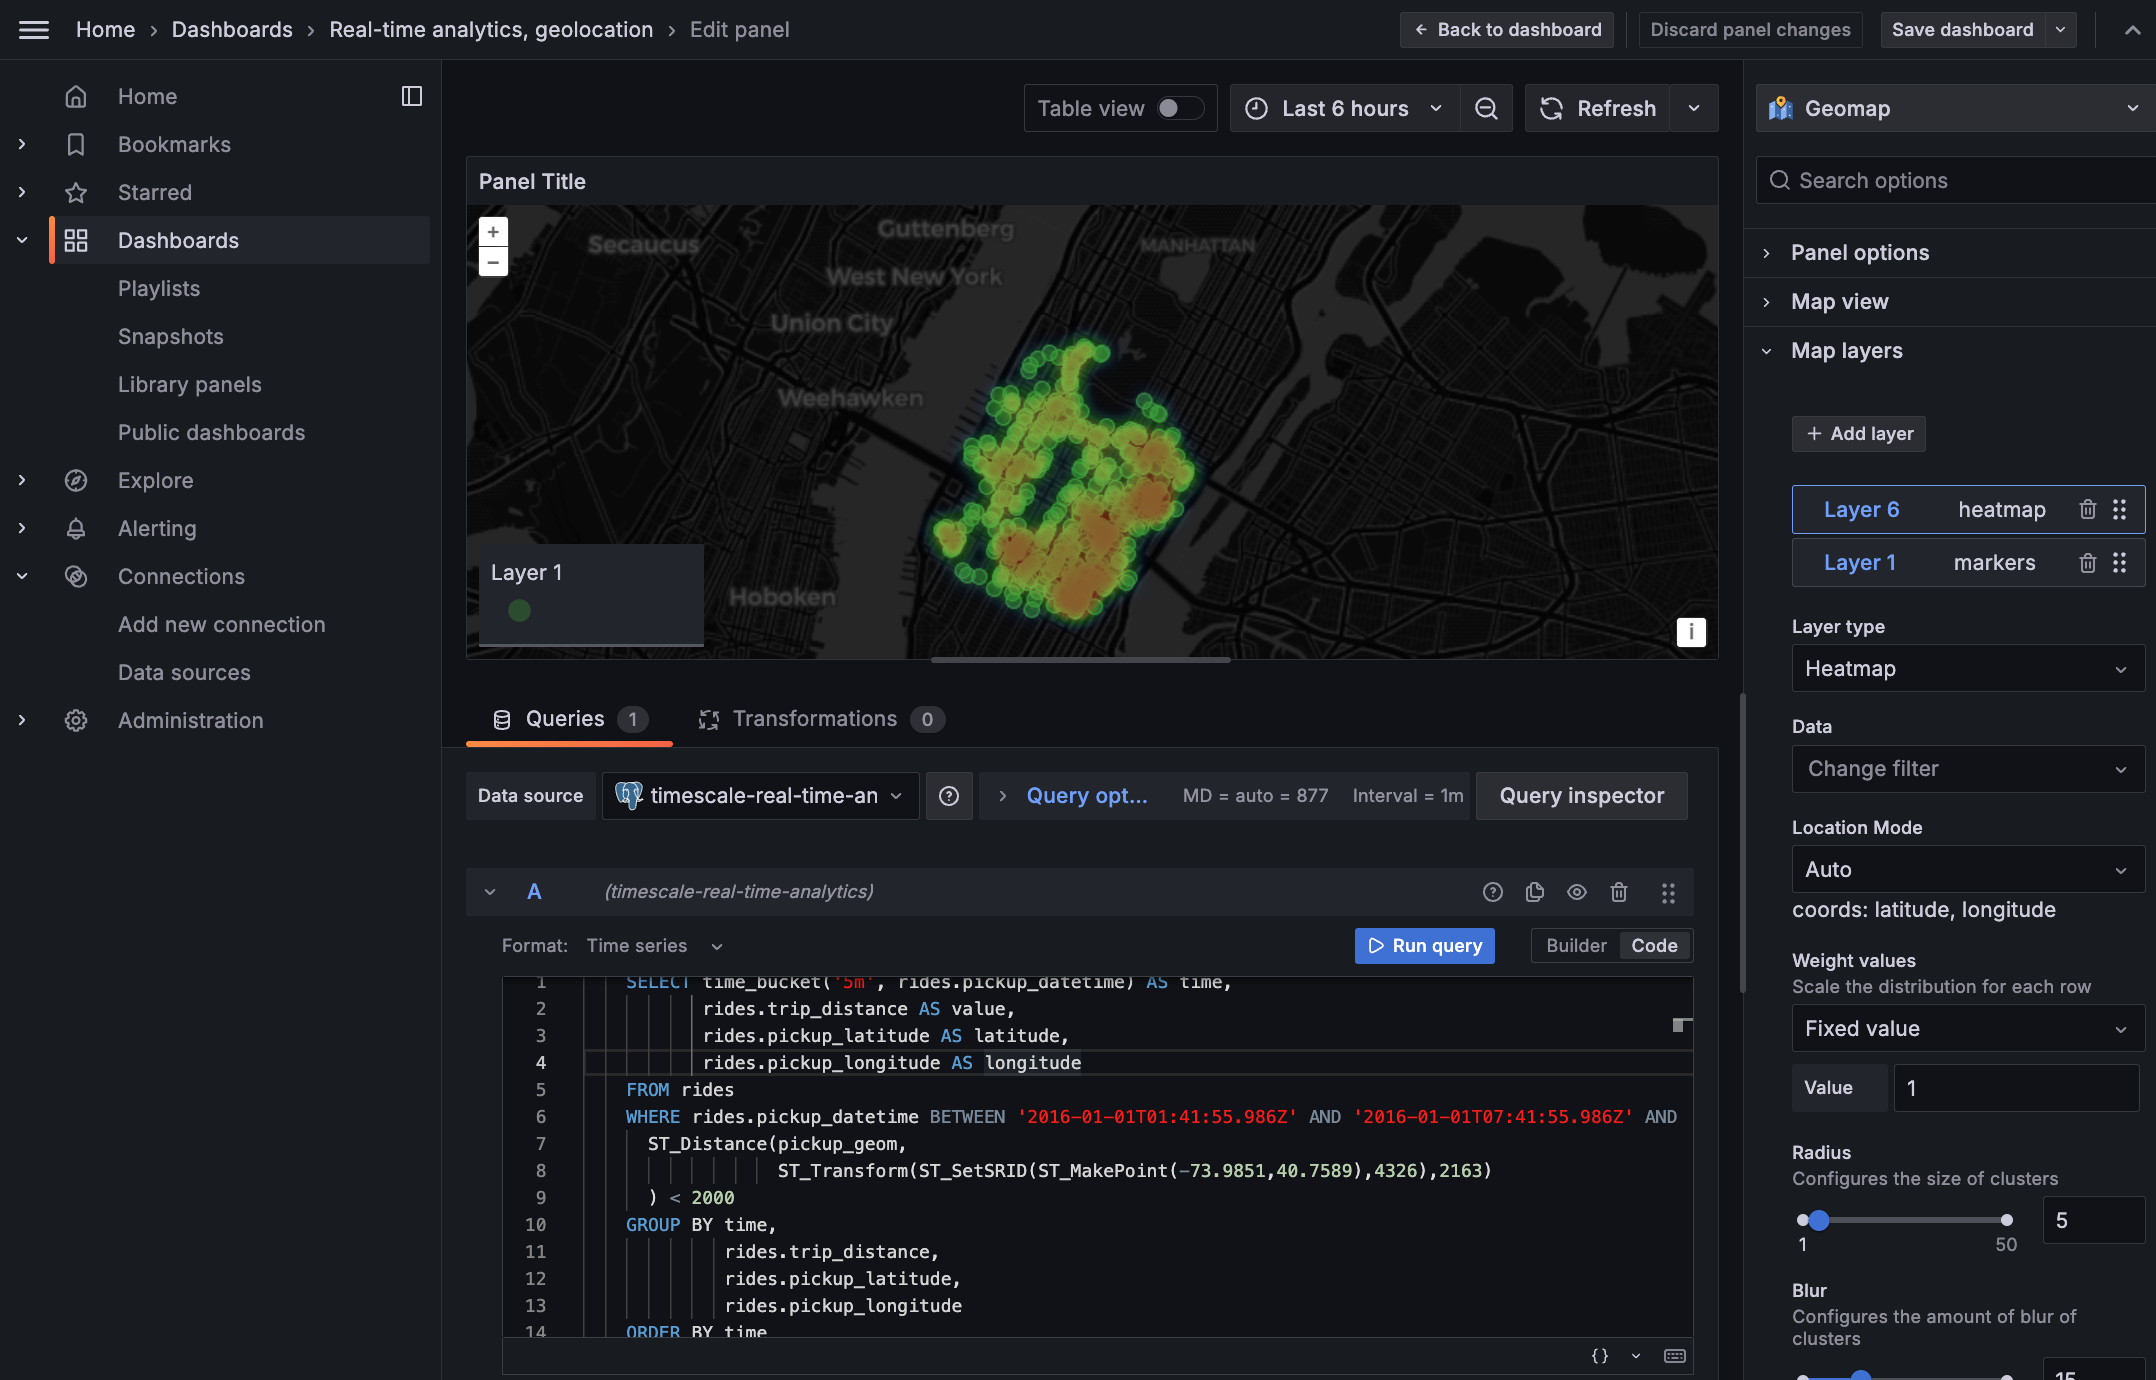
In the Geomap options, under
Map Layers, click+ Add layerand selectHeatmap. You now see the areas where a taxi driver is most likely to pick up a passenger who wants a longer ride, and make more money.
-