import IntegrationPrereqs from "versionContent/_partials/_integration-prereqs.mdx"; import NotSupportedAzure from "versionContent/_partials/_not-supported-for-azure.mdx";
Prometheus is an open-source monitoring system with a dimensional data model, flexible query language, and a modern alerting approach.
This page shows you how to export your $SERVICE_SHORT telemetry to Prometheus:
- For $CLOUD_LONG, using a dedicated Prometheus exporter in $CONSOLE.
- For $SELF_LONG, using Postgres Exporter.
To follow the steps on this page:
-
For $CLOUD_LONG:
Create a target $SERVICE_LONG with the time-series and analytics capability enabled.
-
For $SELF_LONG:
- Create a target $SELF_LONG instance. You need your connection details.
- Install Postgres Exporter. To reduce latency and potential data transfer costs, install Prometheus and Postgres Exporter on a machine in the same AWS region as your $SERVICE_LONG.
To export your data, do the following:
To export metrics from a $SERVICE_LONG, you create a dedicated Prometheus exporter in $CONSOLE, attach it to your $SERVICE_SHORT, then configure Prometheus to scrape metrics using the exposed URL. The Prometheus exporter exposes the metrics related to the $SERVICE_LONG like CPU, memory, and storage. To scrape other metrics, use Postgres Exporter as described for $SELF_LONG. The Prometheus exporter is available for $SCALE and $ENTERPRISE $PRICING_PLANs.
-
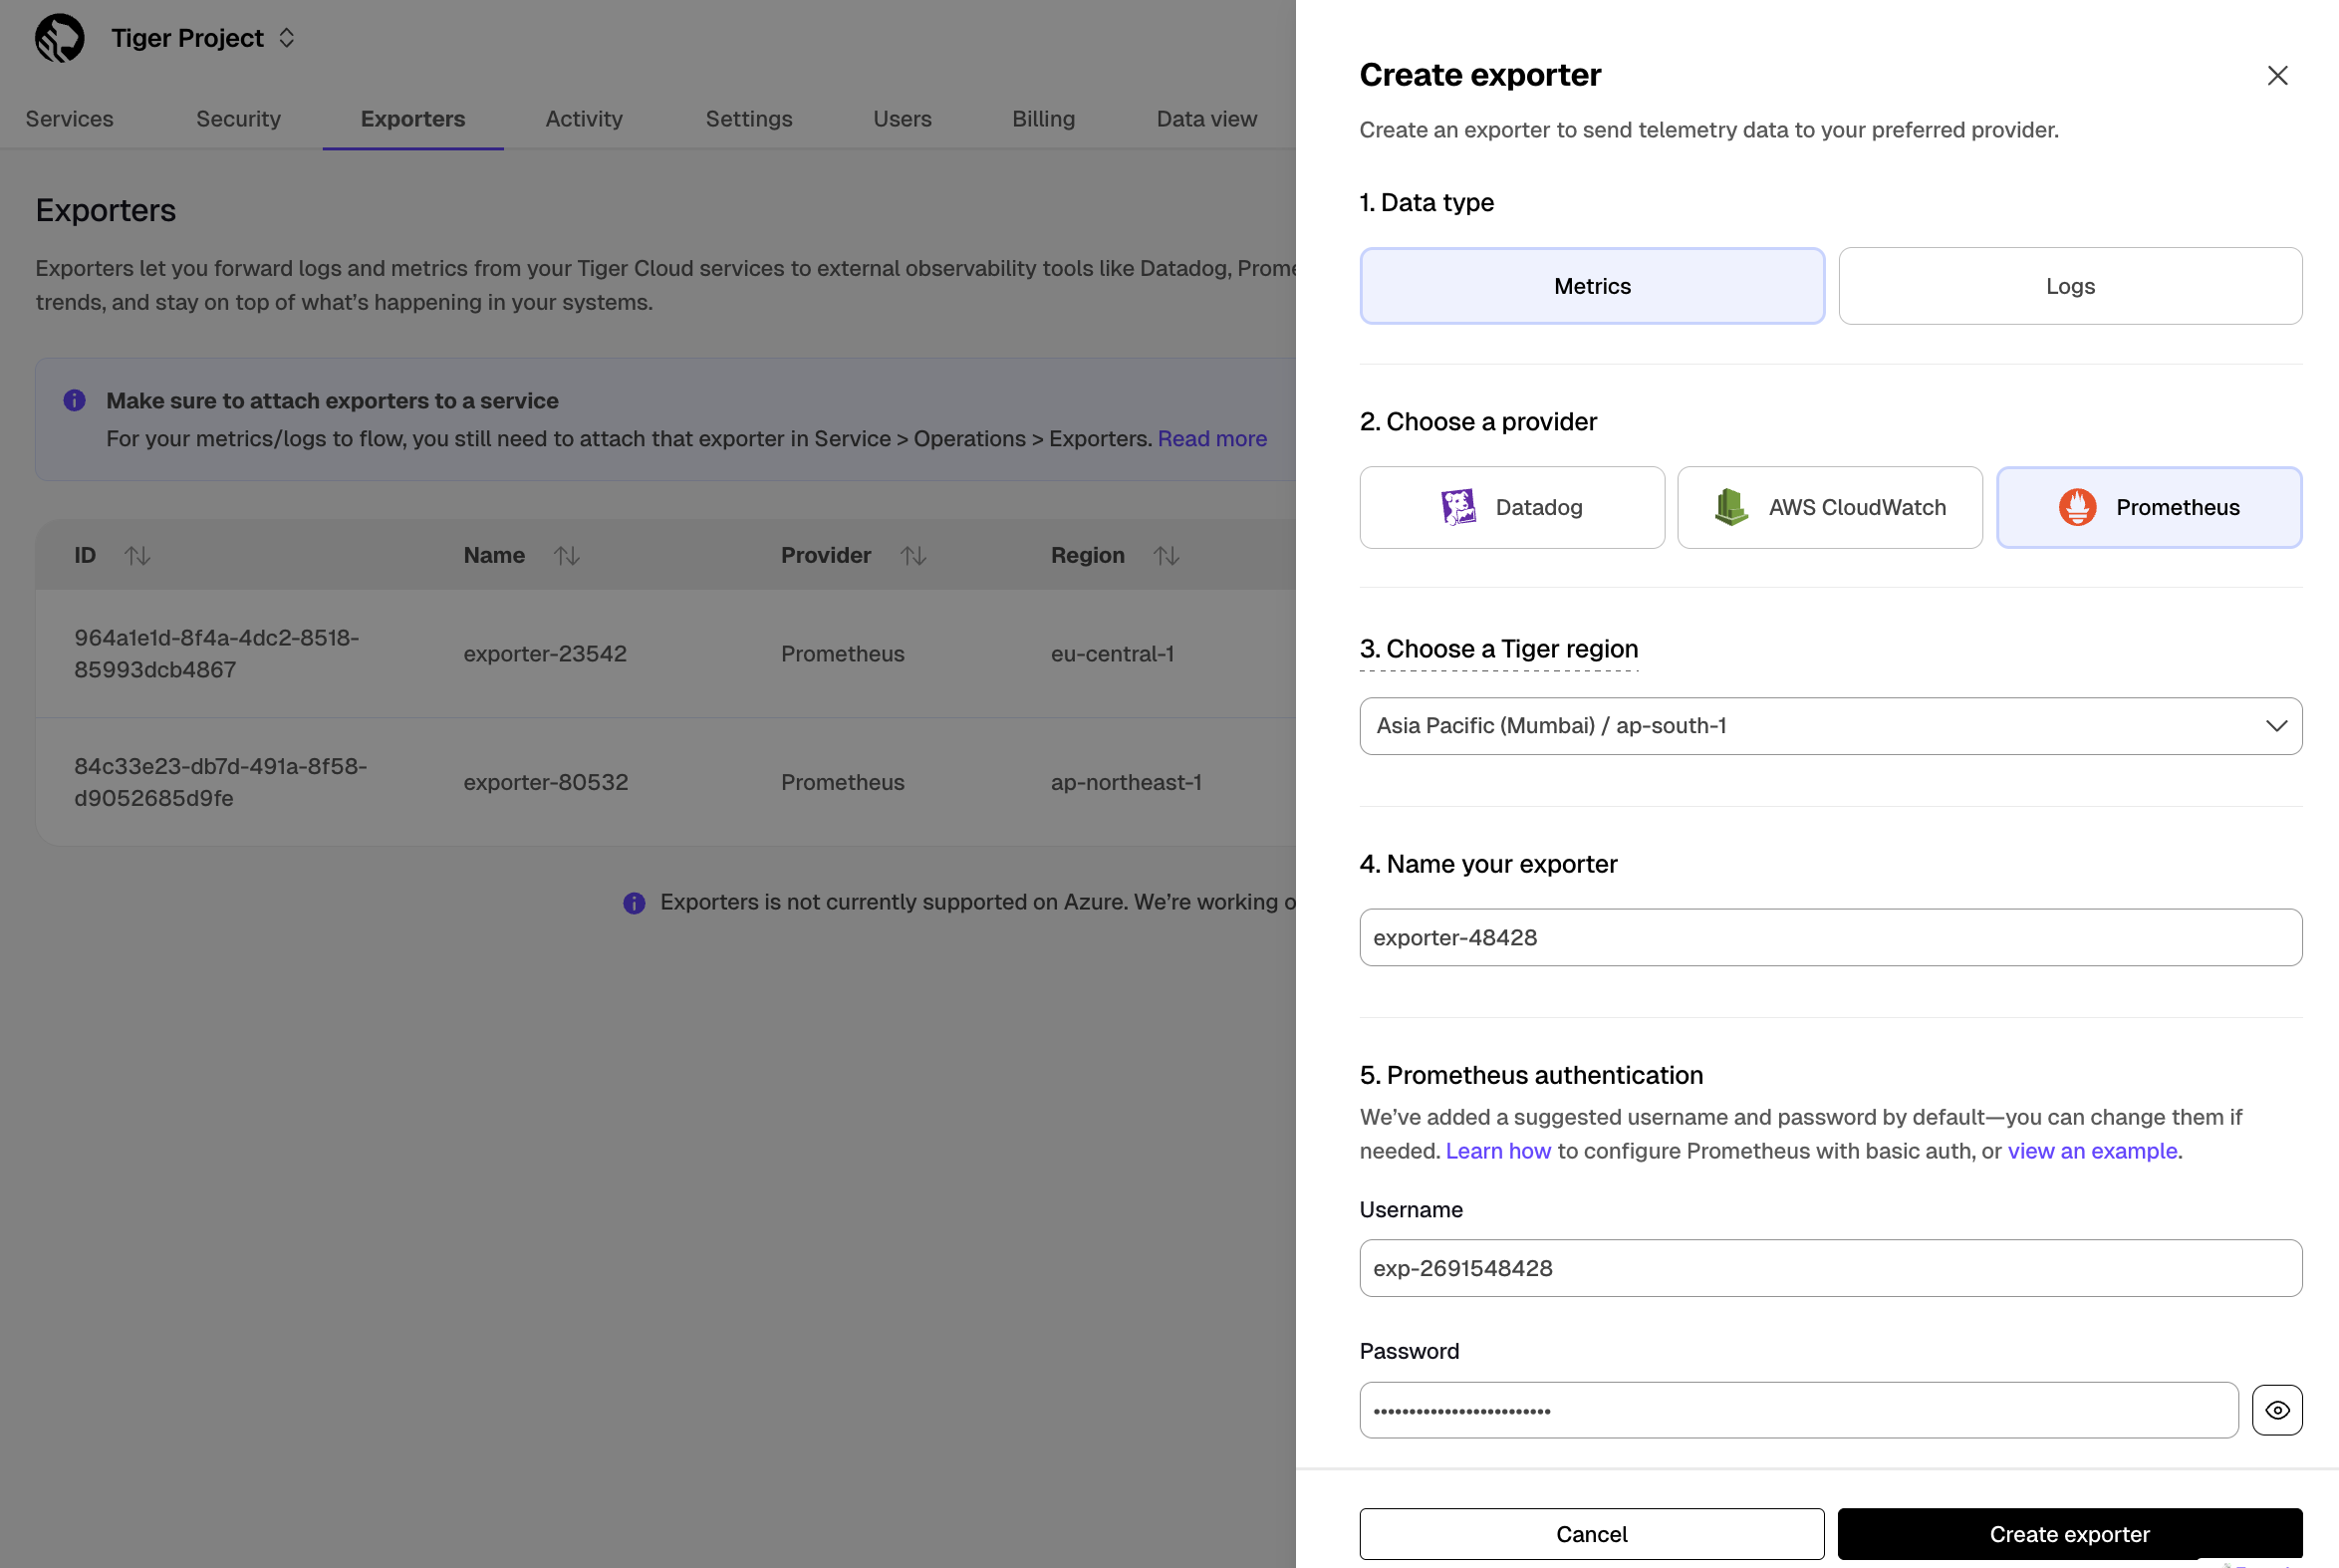
Create a Prometheus exporter
-
In $CONSOLE, click
Exporters>+ New exporter. -
Select
Metricsfor data type andPrometheusfor provider. -
Choose the region for the exporter. Only $SERVICE_SHORTs in the same project and region can be attached to this exporter.
-
Name your exporter.
-
Change the auto-generated Prometheus credentials, if needed. See official documentation on basic authentication in Prometheus.
-
-
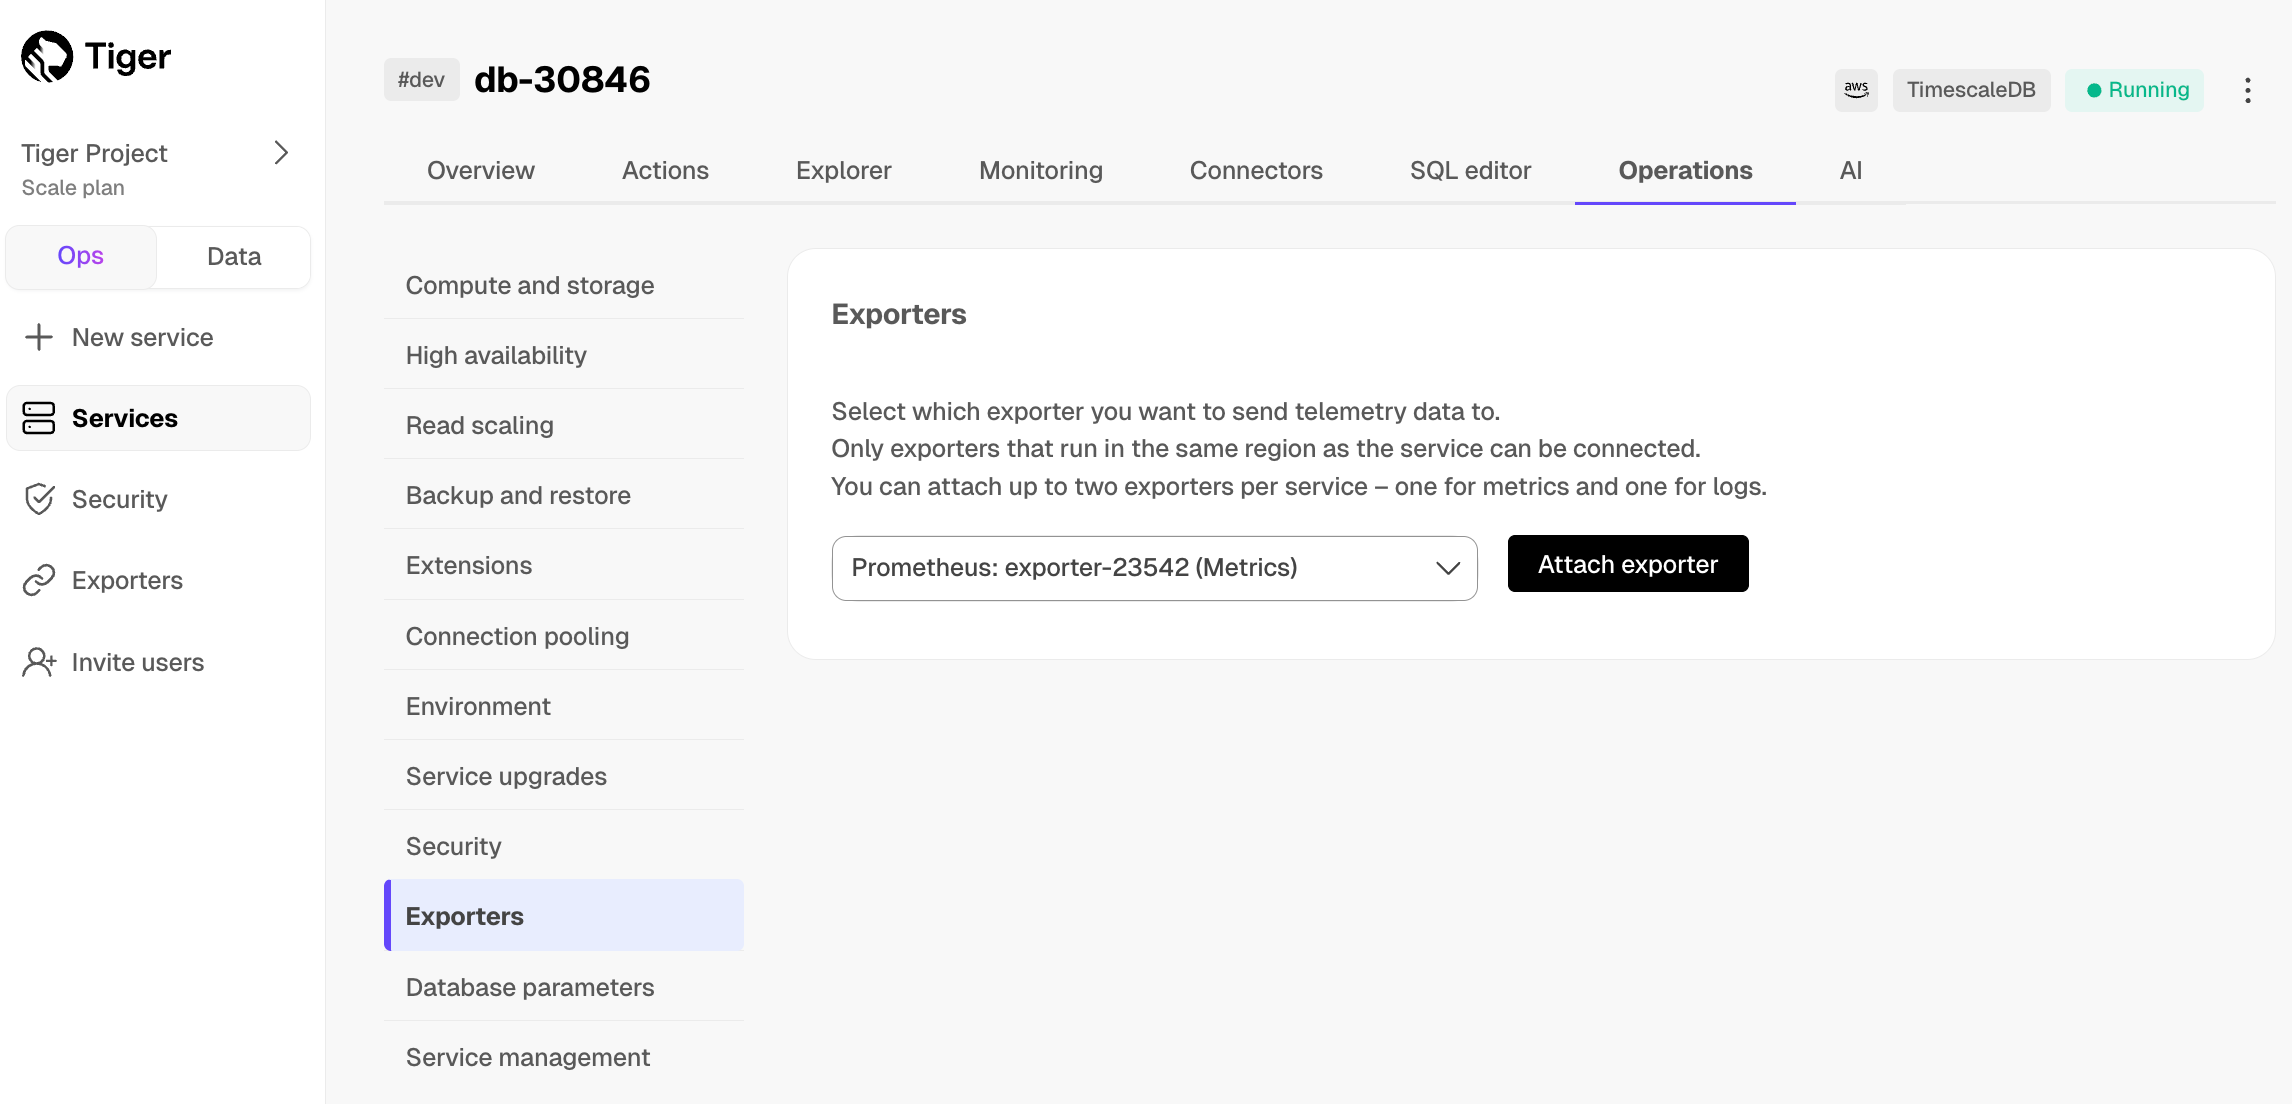
Attach the exporter to a $SERVICE_SHORT
-
Select a $SERVICE_SHORT, then click
Operations>Exporters. -
Select the exporter in the drop-down, then click
Attach exporter.
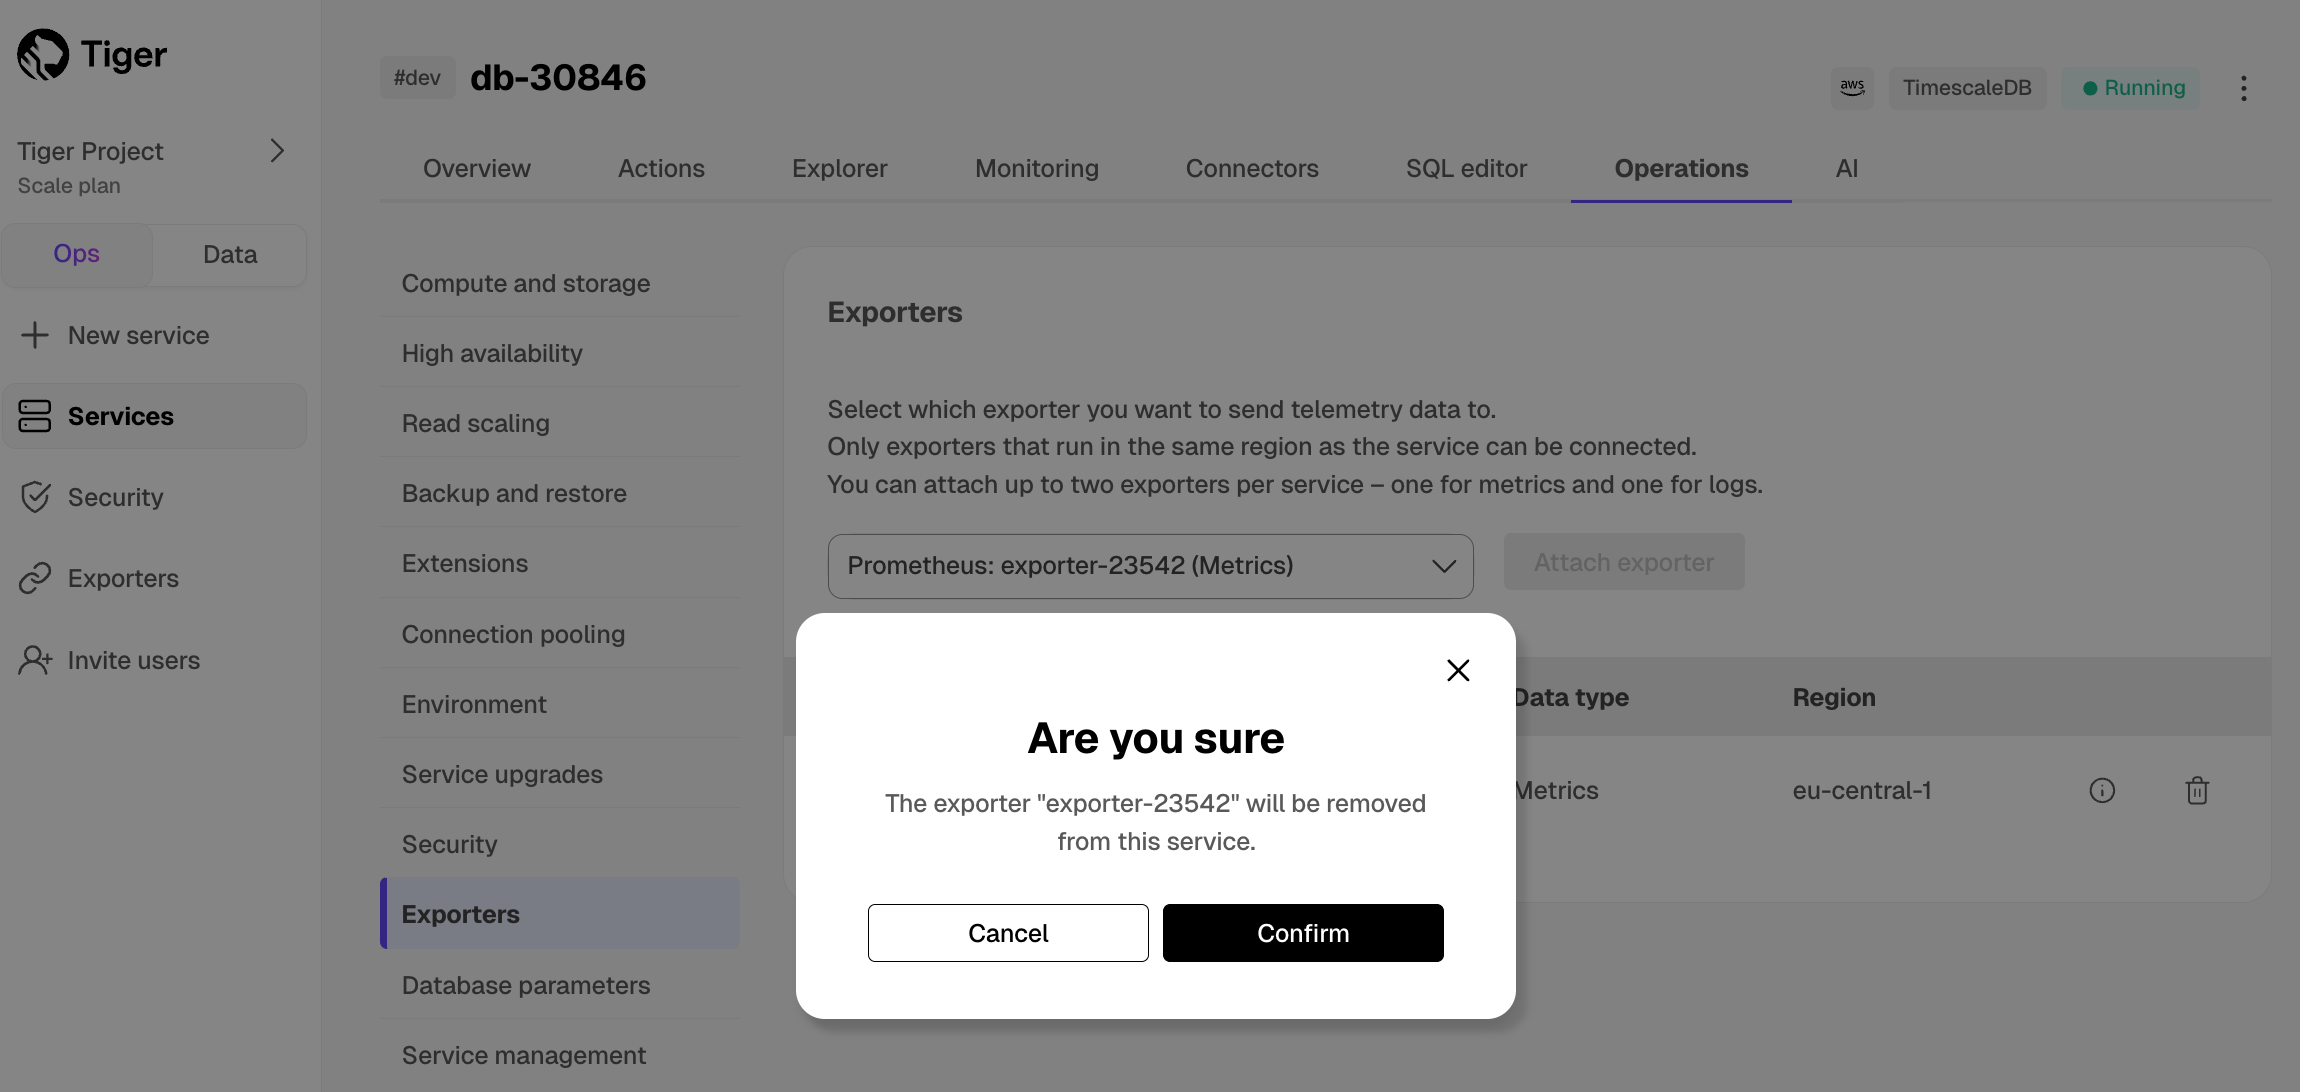
The exporter is now attached to your $SERVICE_SHORT. To unattach it, click the trash icon in the exporter list.
-
-
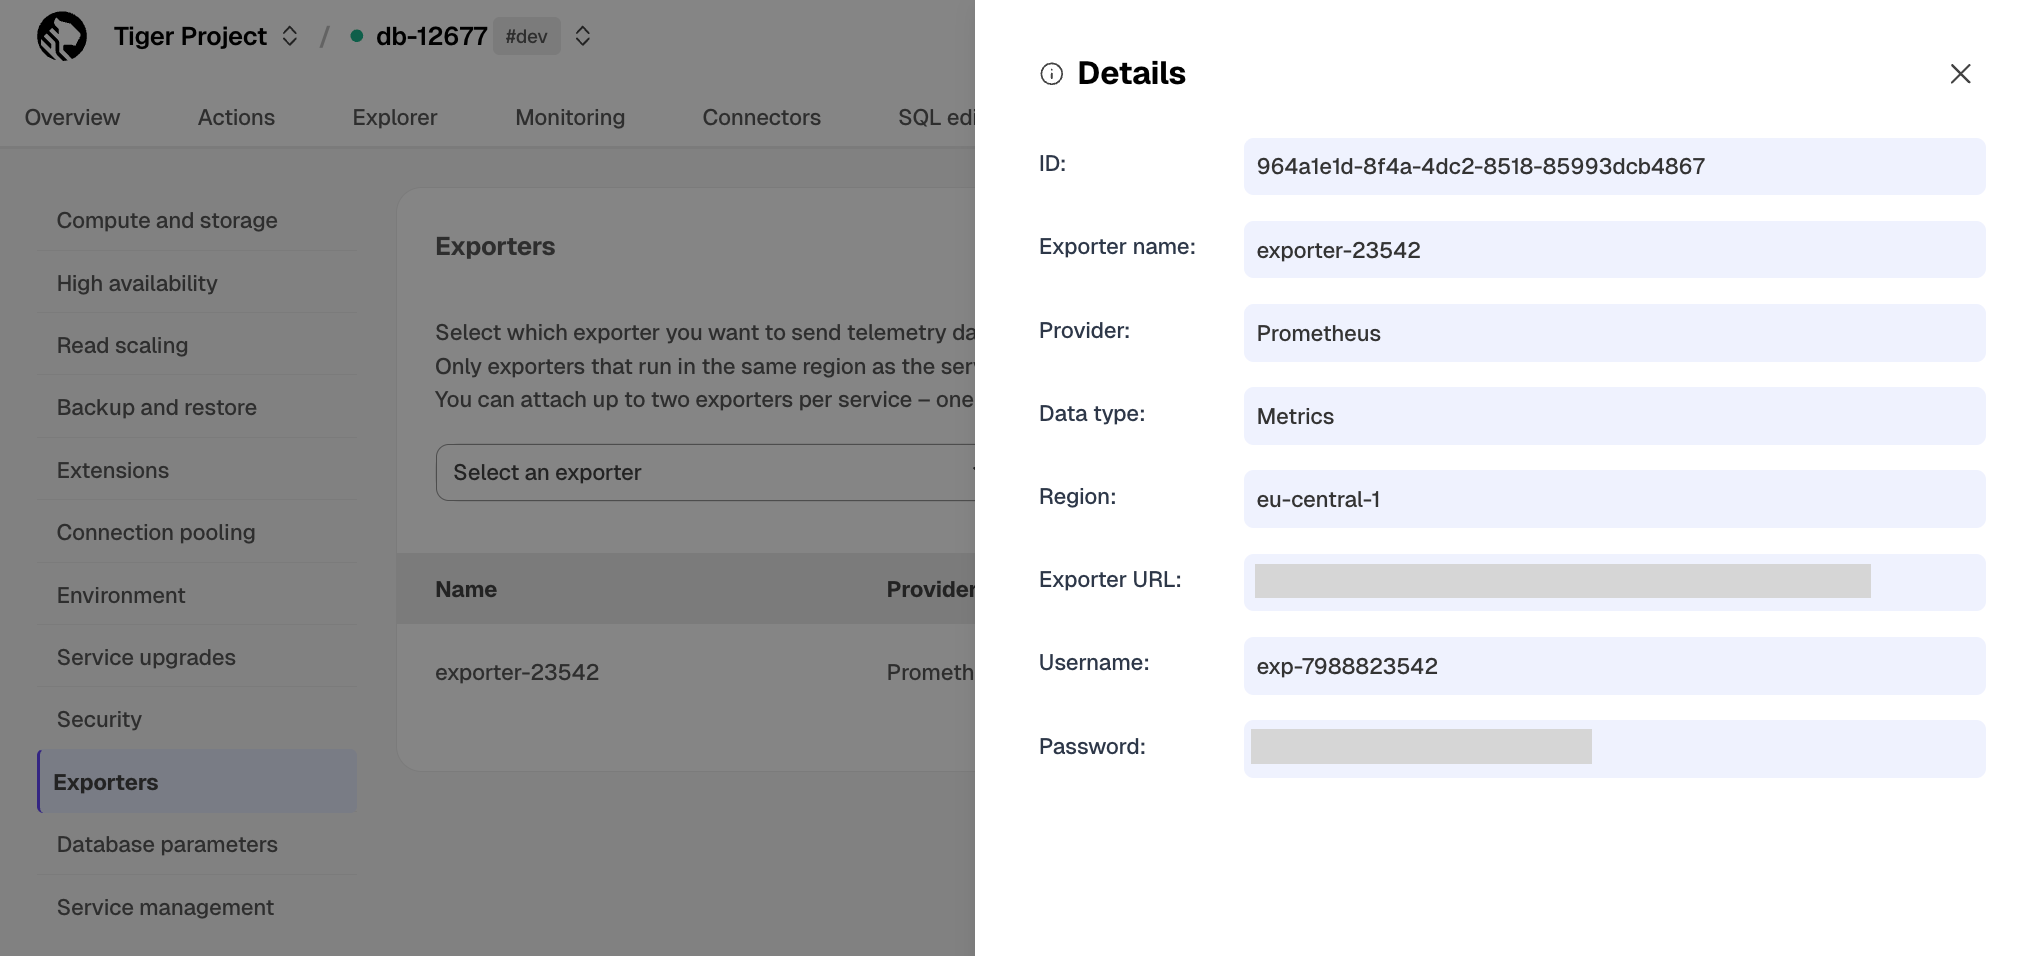
Configure the Prometheus scrape target
-
Select your service, then click
Operations>Exportersand click the information icon next to the exporter. You see the exporter details. -
Copy the exporter URL.
-
In your Prometheus installation, update
prometheus.ymlto point to the exporter URL as a scrape target:scrape_configs: - job_name: "timescaledb-exporter" scheme: https static_configs: - targets: ["my-exporter-url"] basic_auth: username: "user" password: "pass"
See the Prometheus documentation for details on configuring scrape targets.
You can now monitor your $SERVICE_SHORT metrics. Use the following metrics to check the service is running correctly:
timescale.cloud.system.cpu.usage.millicorestimescale.cloud.system.cpu.total.millicorestimescale.cloud.system.memory.usage.bytestimescale.cloud.system.memory.total.bytestimescale.cloud.system.disk.usage.bytestimescale.cloud.system.disk.total.bytes
Additionally, use the following tags to filter your results.
Tag Example variable Description hostus-east-1.timescale.cloudproject-idservice-idregionus-east-1AWS region rolereplicaorprimaryFor $SERVICE_SHORT with replicas
-
To export metrics from $SELF_LONG, you import telemetry data about your database to Postgres Exporter, then configure Prometheus to scrape metrics from it. Postgres Exporter exposes metrics that you define, excluding the system metrics.
-
Create a user to access telemetry data about your database
-
Connect to your database in
psqlusing your connection details. -
Create a user named
monitoringwith a secure password:CREATE USER monitoring WITH PASSWORD '<password>';
-
Grant the
pg_read_all_statspermission to themonitoringuser:GRANT pg_read_all_stats to monitoring;
-
-
Import telemetry data about your database to Postgres Exporter
-
Connect Postgres Exporter to your database:
Use your connection details to import telemetry data about your database. You connect as the
monitoringuser:- Local installation:
export DATA_SOURCE_NAME="postgres://<user>:<password>@<host>:<port>/<database>?sslmode=<sslmode>"
./postgres_exporter
- Docker:
docker run -d \
   -e DATA_SOURCE_NAME="postgres://<user>:<password>@<host>:<port>/<database>?sslmode=<sslmode>" \
   -p 9187:9187 \
   prometheuscommunity/postgres-exporter
- Local installation:
-
Check the metrics for your database in the Prometheus format:
-
Browser:
Navigate to
http://<exporter-host>:9187/metrics. -
Command line:
curl http://<exporter-host>:9187/metrics
-
-
-
Configure Prometheus to scrape metrics
-
In your Prometheus installation, update
prometheus.ymlto point to your Postgres Exporter instance as a scrape target. In the following example, you replace<exporter-host>with the hostname or IP address of the PostgreSQL Exporter.global: scrape_interval: 15s scrape_configs: - job_name: 'postgresql' static_configs: - targets: ['<exporter-host>:9187']
If
prometheus.ymlhas not been created during installation, create it manually. If you are using Docker, you can find the IPAddress inInspect>Networksfor the container running Postgres Exporter. -
Restart Prometheus.
-
Check the Prometheus UI at
http://<prometheus-host>:9090/targetsandhttp://<prometheus-host>:9090/tsdb-status.You see the Postgres Exporter target and the metrics scraped from it.
-
You can further visualize your data with Grafana. Use the Grafana Postgres dashboard or create a custom dashboard that suits your needs.