This section is not the formal technical writeup. What follows is my cleaned-up internal monologue while reversing — the actual sequence of observations, assumptions, dead ends, corrections, and pivots as they happened. The goal is to make it feel like you are sitting in my head while I’m working, without the noise, repetition, or sloppy phrasing of raw notes. A concise technical summary is provided at the end.
If you want to skip to the technical writeup, click here.
Static Analysis
- Kali Linux VM (VirtualBox)
- Ghidra
- Detect It Easy (DIE)
- Sublime Text Build 4200
- PE Entropy Dynamic Analysis
- Windows 10 Home VM (VirtualBox)
- x32dbg / x64dbg
- ScyllaHide
Obtained from ANY.RUN task: 96df65a8-c9d4-4863-bddc-3c66617f0538
Filename:
((((((지원서_240305 누구보다 열심히하는 그런 인재입니다))))).exe
Before touching a disassembler, I always do a fast sanity check: compiler, linker, entropy, imports. This usually tells me what kind of fight I’m about to have.
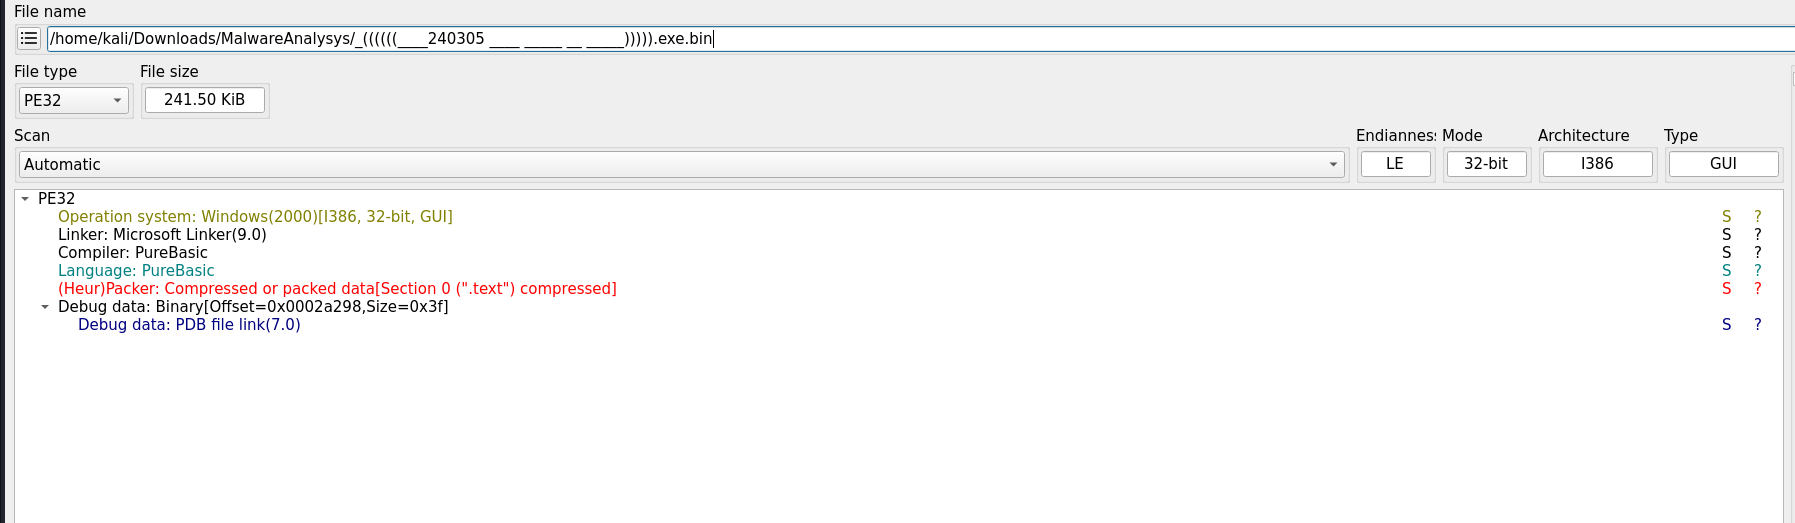
DIE reports:
- Compiler: PureBasic
- Linker: Microsoft Linker That combination alone isn’t alarming, but the entropy immediately is.
.text: 7.71 - this is basically shouting “packed”.rdata: 5.32 - this is the one that actually bothers me
High .text entropy is expected for packers. High .rdata entropy is not. .rdata should be boring. Tables, strings, constants. Seeing it this noisy tells me something is deliberately hiding there.
The imports looked really strange and off, the combination of imports didn't really seem to match and fit. To me, they seemed like they were put there to make it look like It was a legitimate program at first glance. But reading into it, It ticked me the wrong way. There was just way too many imports that did random things, It looked like someone loaded up the microsoft docs and just scrolled and picked functions at random.
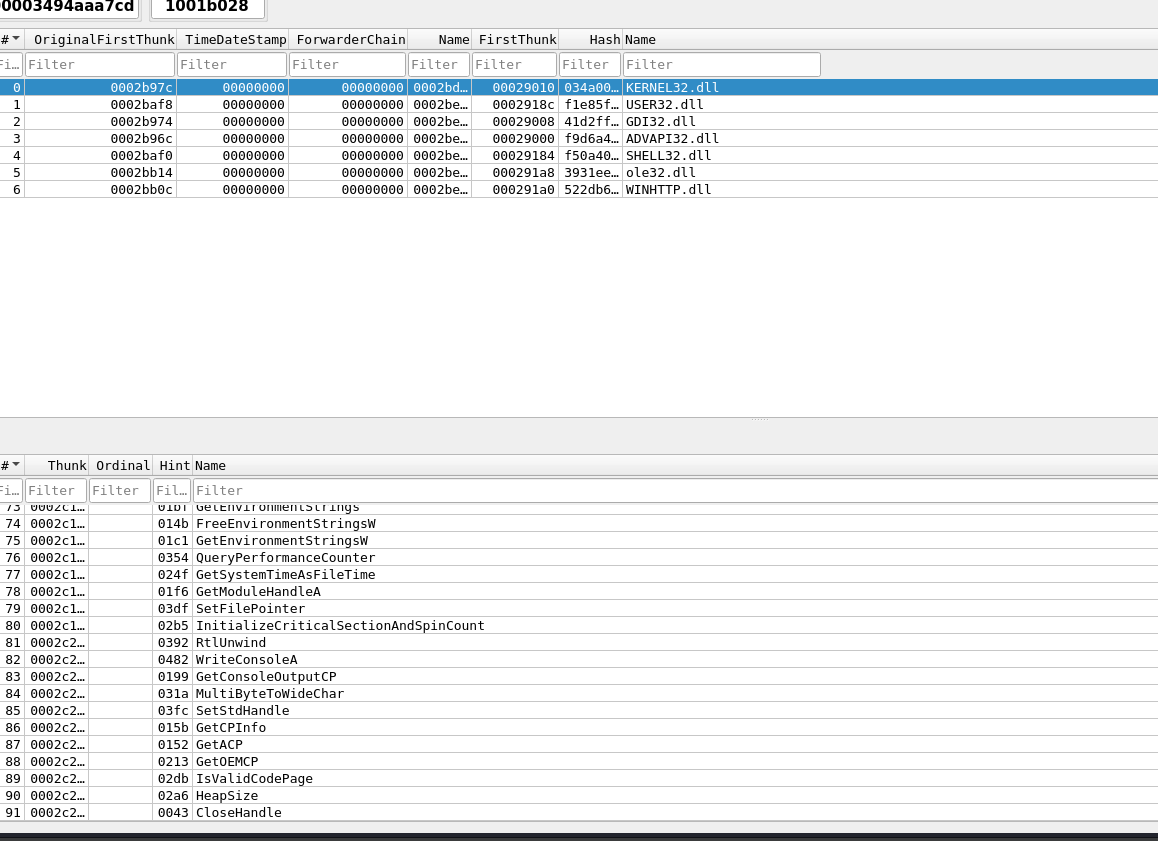
My assumptions based off of the raw information given to me by DIE were: The binary was heavily obfuscated, and the imports were hidden. I assumed there had to be encryption or virtualization because of the entropy.
I always start with strings. It’s cheap and it often leaks intent.
Most of what I see is noise: keyboard spam, junk-looking data, nothing immediately useful.
Then I see LoadLibraryA, This is a solid place to start reversing.
the function usually tells a good story on what the obfuscation is like from it's XREF.
The first function it leads me to is 0x00401224.
And LoadLibraryA starts telling a deep story on how it hides its import(s).
The function I was lead to uses LoadLibraryA to load kernel32.dll. It passes the handle to GetProcAddress as argument 1, but argument 2 is an... Integer Array?
Nothing was done with the array, but it was initialized and passed. My first guess was that it had to construct a string, but decoding the hex told me:
Voterpliart�tcu
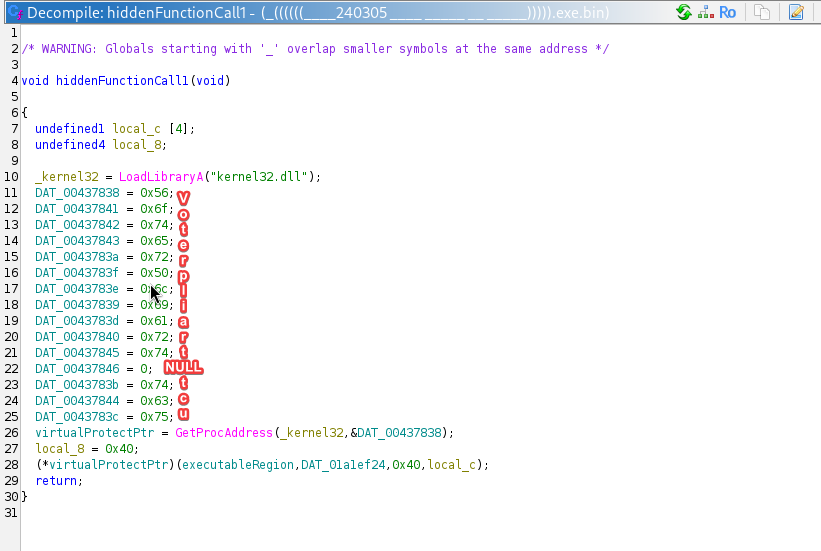
Decoding it in the order provided was junk, but it made me think on why it produced junk. Taking a look at the indexes of the characters, they were all out of order. So what if I restored the order? I fixed up the organization and tried to decode it again and it produced:
VirtualProtect
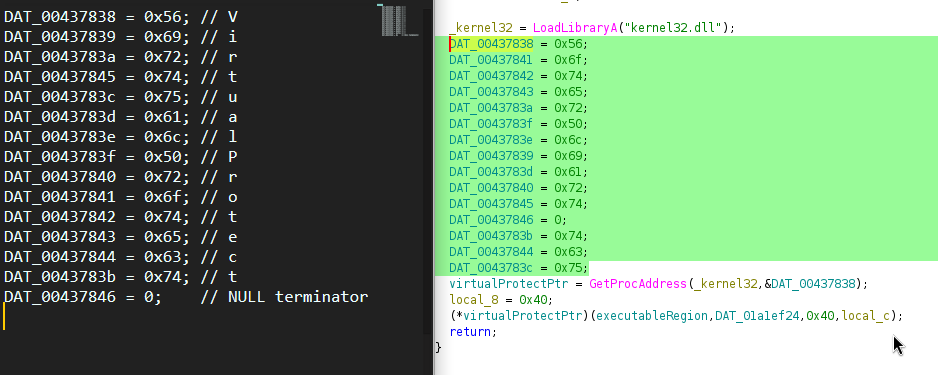
Voilà! The function I was looking at got VirtualProtect from kernel32.dll and called it with some global variables. One thing I took note of was the region flag, 0x40 that equaled PAGE_EXECUTE_READWRITE. But from this function alone, I didn't know what the pointer in paramter 1 or the size in parameter 2 were. I temporarily named them sectionPointer and sectionSize. And so I don't forget this function, I named it VirtualProtectRegion.
I traversed backwards, the XREF showed just 1 call to VirtualProtectRegion. Exploring the new function, the first thing it does is call a different function, one unexplored.
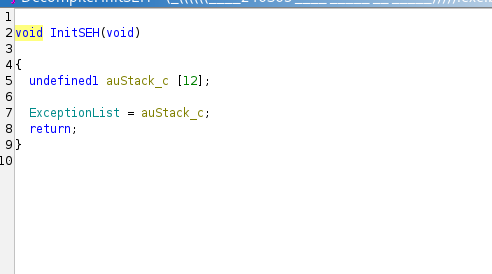
It was a real simple function, It set the ExceptionList and nothing more. I named it to InitSEH ( which is incorrect ), and moved on.
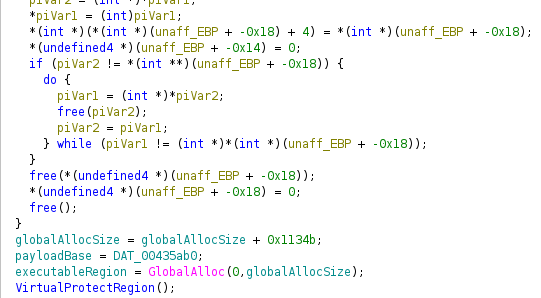
The next line checked sectionSize against 0x93, and this is where the binary gets all of imports. The if statement was huge and full to the brim of imports that did nothing, and code that just didn't look right. I glance over it and move on, I didn't know the value of sectionSize, and If I find out the if statement was true, I would return. Then I get my answer for what sectionSize might be, but not exactly. The next line added 0x1134b to sectionSize, then moved a pointer to another pointer. Usually this is pretty normal, but the next like called GlobalAlloc with 0 and sectionSize. 0, saying it was fixed memory, meaning it wouldn't be moved of shifted, and the size of sectionSize. I rename sectionSize to globalAllocSize, a lot wordier but easier to understand, and more correct. And the binary sets the pointer to this section, this pointer was sectionPointer. This clicks the dots together, this was the executable, readable and writiable section of memory that strongly suggested it contained the next payload. I changed the name of sectionPointer to executableRegion for clarity.
It feels critical to mention the difference between read, write and read, write, execute memory regions. The difference is in functionality, EDR solutions wouldn't care as much if you wrote shellcode into a read, write memory section as there's nothing much to do with that shellcode. While read, write, execution sections are heavily monitored, These sections allow code to be executed out of it. A Pointer could be passed into this section and it will attempt to run the region as if it contained code. If a pointer was passed into a read, write region, it would cause an error and throw an exception.
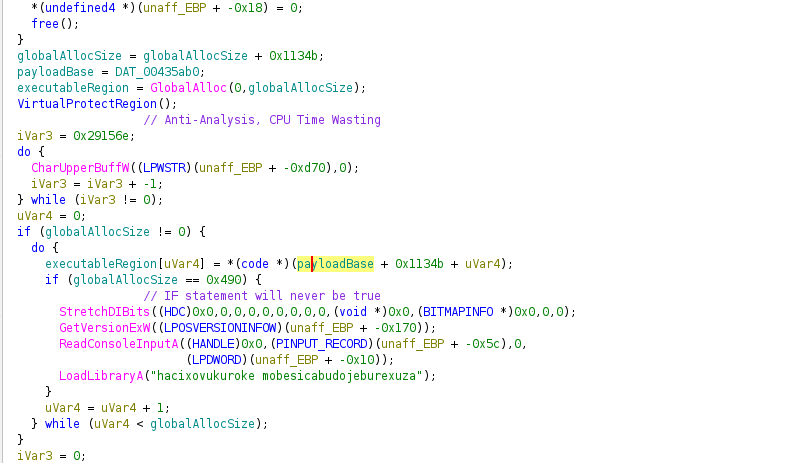
From the image you can see that the pointers I mentioned have names. Where'd these names come from? the next couple of lines. Skipping overy junk code, I see that executableRegion is being written into. There's a loop that continues until increment matches globalAllocSize, and it's writing payloadbase + 0x1134b + increment to executableRegion[increment]. The name payloadBase was assumed becuase that must be where the payload starts, and it is offset by 0x1134b. I have seen 0x1134b before, It was used to increase globalAllocSize.
Truth be told, I don't know. But I can take an accurate guess as to where it is with PE Entropy, a tool I built meant just for this. The tool was inspired from this reversal as I struggled to find the payload for 3 days. I eventually had a simpler solution, but it's better to reflect and see what I missed.
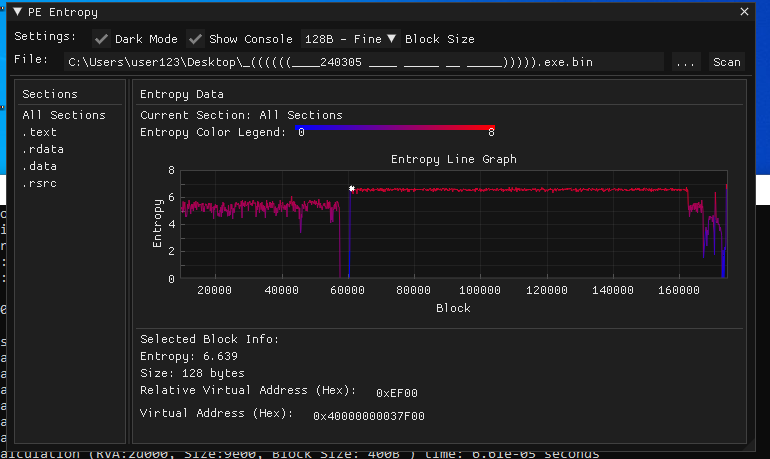
As you can see from the screenshot, there's a sudden spike and a constant entropy. and jumping to it shows a blob of just data. This is most likely where the payload lives, at 0xEF00.
So why did I struggle? Well there was nothing explicitly pointing at this section saying "HI IM THE PAYLOAD". This payload was just stuck in the middle of the file, as you can see from the screenshot. The section of code at the start of the binary dies off and then there's just a massive spike of entropy that peaks and stays at that peak. This is why I like this tool, It visually maps out the entropy and really spells out what the binary really does. And to be truthful, in one of the 3 days I spent looking for this payload, I scrolled the entire binary searching for it. If I made this tool sooner, this article would've been made 3 days earlier.
This form of concealing a payload is called "Section-agnostic payload smuggling", breaking all rules, the payload lives outside of any section, isn't discoverable by section-based reasoning and is invisible to tools that trust PE structure. This defeats a lot of tools such as Static scanners, signature engins, and static analysts ( such as me ). The blob treated the executable as raw storage, not a structured format. This is the reason it took so long to locate the payload.
I can almost guarantee that is not a PE Loader. A PE loader is a type of malware that loads another executable from memory, but this process is complex. A PE Loader must recreate the actions done by LoadLibrary, So It needs to load the imports and set the IAT table to the correct pointers, patch the CRT, and fix the relocations. It's required to parse the PE Headers for any of this happen, and I simply haven't seen that yet. These facts point towards the idea that this dropper loads shellcode, this shellcode might have it's own import resolving, and patch all of necessities on its own.
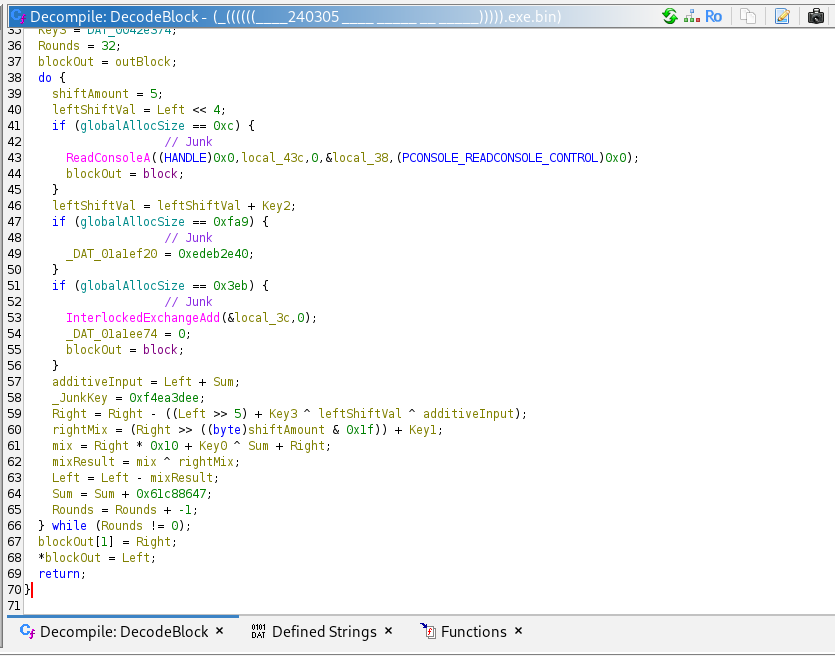
The program can't just run encrypted shellcode, it needs to decrypt it. And it does this task in the next line where it iterates through globalAllocSize 8 byte blocks. these 8 byte blocks are passed to a function as a pointer. This is extremely obvious decrypter schema, and investigating the function proves that. This new function that I've named accordingly as DecodeBlock decrypts executableRegion. It uses 4 keys:
- DAT_0042e368 ( key 1 ) = 30C1F077h
- DAT_0042e36c ( key 2 ) = A597F02Ch
- DAT_0042e370 ( key 3 ) = 0EB0BA0Ah
- DAT_0042e374 ( key 4 ) = D41CC0E6h
What are these keys used for? Well the function:
- Runs 32 rounds
- Uses a non standard sum ( sum =
575) - Uses a delta constant ( sum +=
0x61C88647) - Uses Feistel-style mixing
This style of decryption comes from the TEA/XTEA family. Cryptography isn't my speciality so I won't get too much into the details, but you can see the functionality here:
I also made a small snippet of psuedo code to explain the function and help myself map it mentally:
void DecodeBlock(uint32_t block[2])
{
    uint32_t left  = block[0];
    uint32_t right = block[1];

    uint32_t key0 = DAT_0042e368; // 30C1F077h
    uint32_t key1 = DAT_0042e36c; // A597F02Ch
    uint32_t key2 = DAT_0042e370; // 0EB0BA0Ah
    uint32_t key3 = DAT_0042e374; // D41CC0E6h

    uint32_t sum = 575;
    int rounds = 32;

    do {
        right -= ((left >> 5) + key3) ^ ((left << 4) + key2) ^ (left + sum);
        left  -= ((right >> 5) + key1) ^ ((right << 4) + key0) ^ (right + sum);

        sum += 0x61c88647;
    } while (--rounds);

    block[0] = left;
    block[1] = right;
}So let's recap, what does this binary do so far? The binary Creates a new fixed global memory block the size of globalAllocSize. It changes the protection of this new region to be RWX ( Read, Write, eXecute ). It drops the payload from payloadBase + 0x1134b into this region. Then it decrypts the executable region with a TEA/TEAX variant decrypter. The region is executed by calling executableRegion as a function. With this in mind, it's time to get the next payload, and to do that I'm transitioning to
Fresh Windows 10 VM:
- No network
- No 3D acceleration
- Snapshot taken
Using x64dbg, I first change some settings, I enable breakpoint on entry so that I don't accidentally detonate the malware. Then I jump to the address before the call to executableRegion, which is a LoadLibrary that loads msimg32.dll. I let the binary run until I hit that breakpoint, at which point I started looking for the payload code. I spent a bit searching through the variables, but I eventually just stepped into the executable memory.
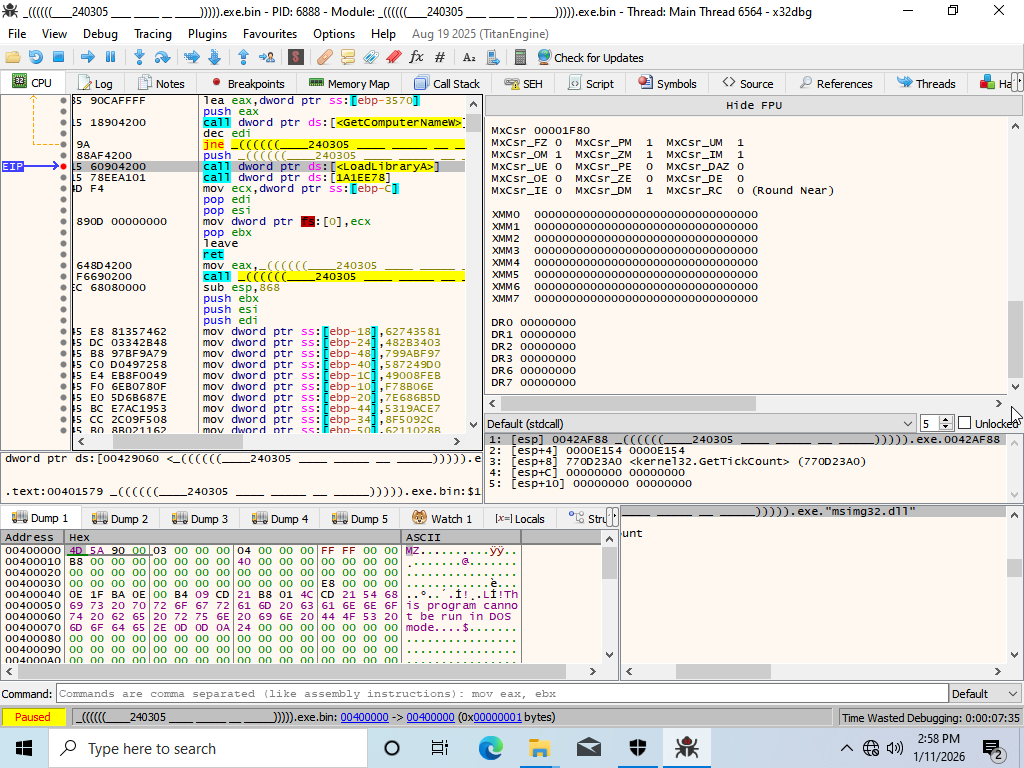
I used ScyllaHide to dump the memory region and get the next payload. Although, I can't confirm quite yet what the payload is, I transfered the dump to my kali vm. In Kali I checked the dump with DIE again, and it confirmed that I was successful.
DIE reports:
- 32-bit
- No compiler signature
- Entry-point NOP Entropy is still high:
- Overall: 7.17
.data: 7.89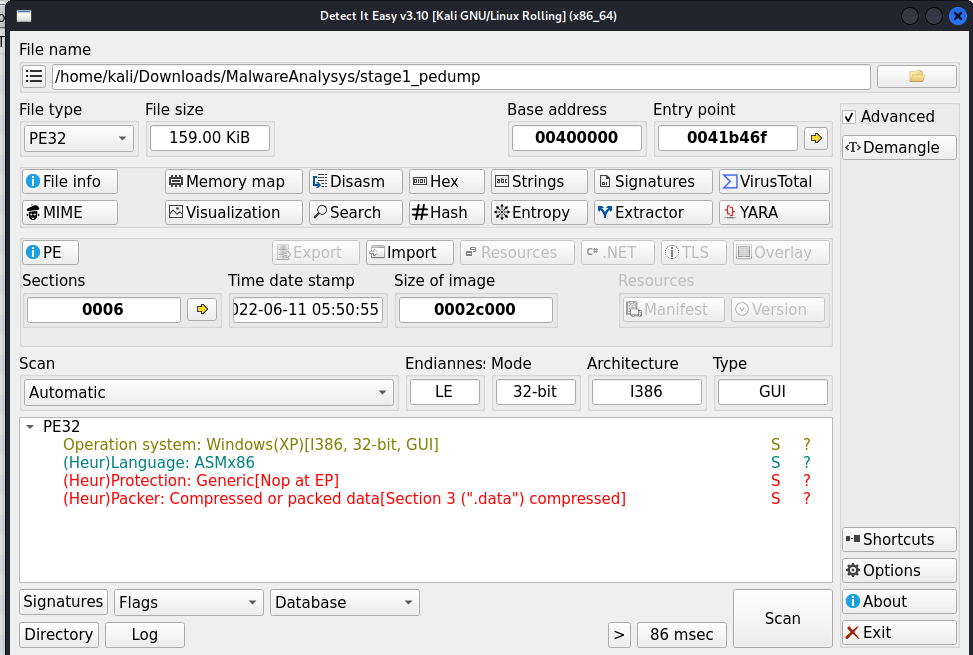
So what is this brick of data mean? the lack of a compiler signature means this payload wasn't produced by any standard compiler. The entry point nop simply means that the writers put a NOP statement at the beginning of the shellcode, most likely the decryption function padding. And the high entropy links back to what I previously said about stage 0. I am expecting some encryption as protection in this binary. With that in mind, I'm going to plug it into ghidra and hope that it decompiles.
Entry function:
- ~89 parameters
- Mostly junk
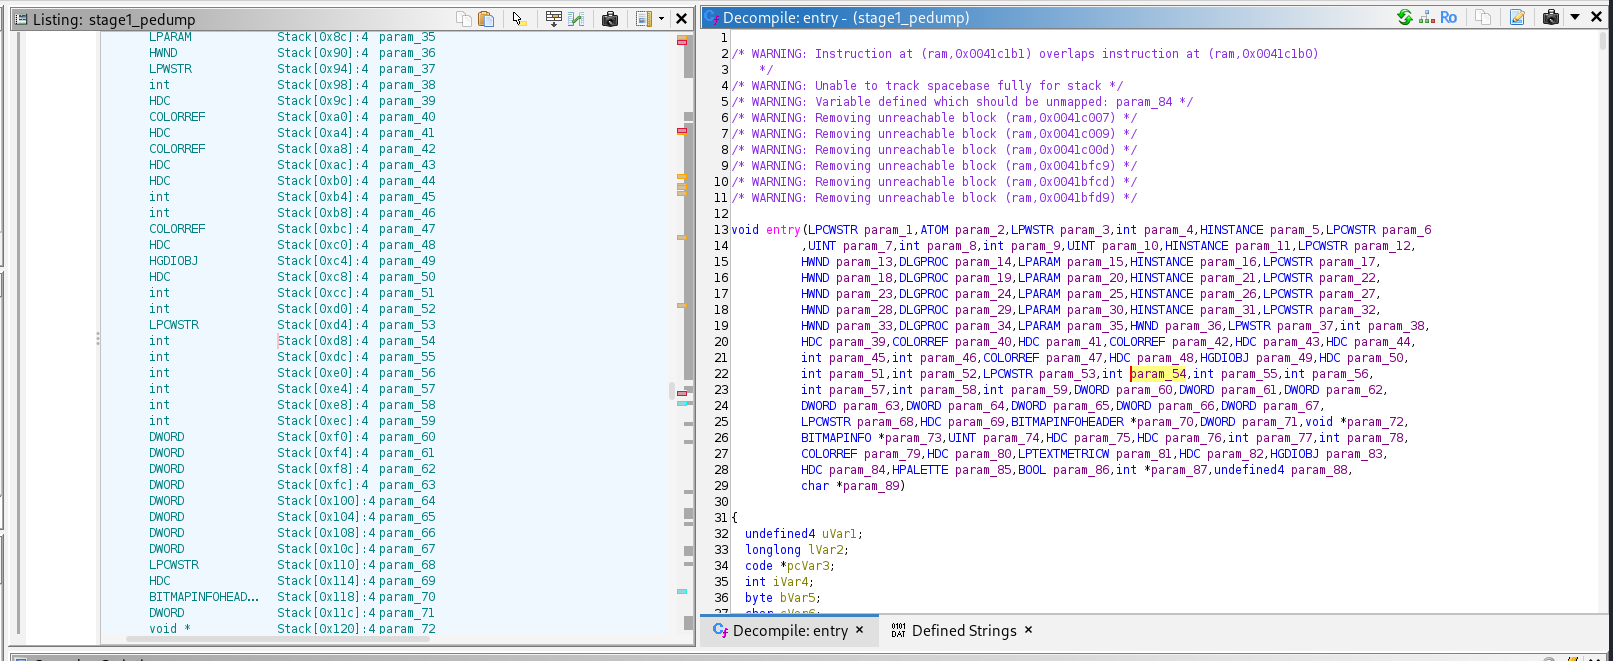
If you haven't made the assumption already, the binary did decompile and shockingly has a PE image. My initial reaction to the entry point was fear, the function looked terrifying. Skimming through the code, I see a wall of the same statement over and over. And at the bottom of the function, there was nonsensical code which almost convinced me that I dumped the wrong memory region. Taking a deep breath and starting from the top, I see 4 function calls. Clicking on the first one, I wince and think "maybe I do need to redump" the function was empty with just a return statement. Before I gave up, I checked the second function call, and almost jumped out of my chair. A valid function that didn't look like an incoherent mess. This saved me from redumping, If I couldn't find any valid code, It means the dump was terribly wrong. But having a real function showed that the writers purposefully tried to hide the functionality and make the entry look like a dumping error.
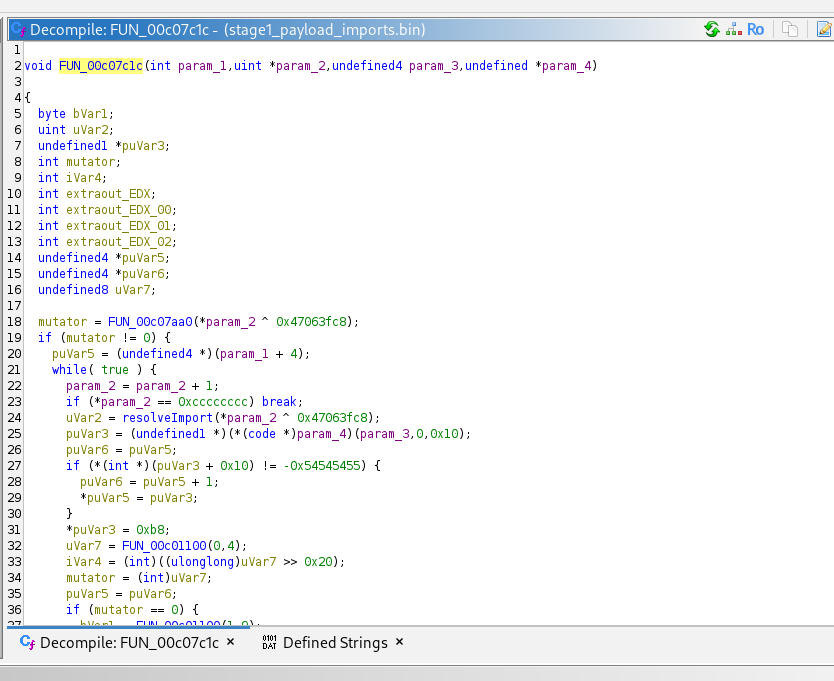
Clicking around some functions inside this one, I see some key details. I see ProcessEnvironmentBlock + 0xc and a while true statement which fetches data from the PEB block. I know what I'm in for, this is obvious signs of dynamic importing. So what is this function doing? It first singles out 2 hashes, checks if the functions exist, and calls the first one, then it passes the second function into more functions that appear to find more imports.

So what is dynamic importing and why is it important? The main function called from the entrypoint, I named DynamicallyResolveImports and the functions that search for a hash I named resolveImport. resolveImport does what I just said, it loops through all of the loaded modules, from that module it loops through its exports, each export is hashed. This hash is compared against the target hash passed in the first parameter and if it matches, it checks to see if this export is really valid, if it is, it's returned, if it's not, it breaks. These two functions are why this payload is able to run as shellcode.
So how did I reverse these hashes? What I did to find the function is I jumped right after the if statement to see if the function it found matches the target in x32dbg (x32 now because this is an x32 binary). Doing this, I skimmed through the instruction values for the function, then found one specific instruction that leaks which function matches the target hash. "LEA EAX" the pointer to the target function is stored in EAX. I did this for the first 2 hashes, to discover that:
-0x7f0e718=RtlCreateHeap0x6e6047db=RtlAllocateHeapUsing dynamic analysis saved me lots of time and plenty of headaches. Dynamically reversing this part makes the most sense because: it's the real, live output. RecreatingresolveImportwould've been costly on time and thinking power. The only headache you have with dynamic reversing ( at least with this method ) is trying to save every last import and correlate it back to the static binary.
What DynamicallyResolveImports does is it calls creates a new heap, this heap has a size of 0x41002. The function later passes this heap, as well as RtlAllocateHeap into a new function about 19 times. Each call, the 1st parameter increases in size and has a different pointer in parameter 2.
The function XOR's parameter 2 by 0x47063fc8, then it, wait it XOR's a pointer? clicking through the pointers passed in parameter 2 takes us to completely random places in the binary. This XOR'd value most likely contains the hashes to more imports, proven because they're being passed back into resolveImport or a variant of it. This variant appears to load any modules that stage 0 might've missed and is only called once before resolving the imports. The big question is: Where are these imports being stored? I'm aware that the imports have to somehow end up in pointers because that's how the payload calls them for it's malicious functionality. I took a glimpse into some of the other functions in entry to prove this. but this new function reallocates 0x10 bytes of fixed heap just like stage 0. But this is where it gets weird, it generates a random number 0-4 and depending on that number it does different things with the resolved import. Like if the number is 2, it XORs the value and writes it into those 10 bytes of heap with weird hex numbers also being writen.. ohh this is text book polymorphism. So the pointers scattered around the binary that call the function imports don't actually directly lead to the function imports. It leads to mini shellcode snippets, a trampoline to the imports. Every time you run this payload, the imports will have different shellcode. This means that call sites never reference real API addresses. This is critical as it breaks CFG ( Control Flow Guard ) recovery, API based heuristics fail, and memory scanners see code not pointers. Before this payload was signature scanned as LockBit or a dropper, it most likely was flagged as clean for a short amount of time.

Now that I've found out how the binary hides its imports, what's up with the lack of strings? Taking a stroll down the other functions called in entry, I can see these blobs of large hex integers stored in array being passed to a function. Investigating this function shows that it loops through the 1st parameter, XOR's it by 0x47063fc8 and uses a bitwise NOT statement on each value. This just simply has to be the string encryption, and the decrypt function is so laughably easy to recreate, which is exactly what I did. To decode the strings, I just used the XREF because apparently every single string uses this function. Using my decoder function and some time, I managed to grab almost every string in the binary. Some strings stay non-printable, kept as hex, but all of the strings can be accessed here.
The core mechanism behind the dropper is executing x32 shellcode. This is achieved via a direct call to RWX memory that contains the decrypted payload. The payload is decrypted inside the memory region by a TEA/TEAX derived decryption cycle. The encrypted payload is dropped into the region statically.

Made with drawio.
YARA can temporarily surface this loader because Stage 0 exposes multiple low-cost static invariants that the writer would have to meaningfully redesign to remove. Some temporary solutions can include: Detecting the decryption cycle is also plausible as it uses 32 fixed rounds, two 32 bit words per block, Feistel mixing, shifting and XOR. The large continous encrypted payload in the binary can also be detected.
These YARA rules should not serve as the final solution to detecting this lockbit varient and should only be for short term fixes. These rules are for educational purposes.
This rules is the overall strongest way to detect Stage 0. The biggest flaw with this rule is that it is specific to this sample. Other samples may contain mutations that modify the decryption cycle which avoids this rule. For clarity on what each string defines, here's a table:
| String Name | Detection |
|---|---|
| $delta | The static integer used in the delta constant, strong |
| $shift1 | Shift opcode 1, weak |
| $shift2 | Shift opcode 2, weak |
| $round32 | Fixed round counter literal, questionable, not enforced |
rule LockBit_Black_Stage0_TEA_Decryption
{
    meta:
        description = "Detects TEA-like decryption routine used in LockBit Black Stage 0 loader"
        author = "VeryCuteLookingCat"
        confidence = "medium"
        scope = "static"

    strings:
        $delta = { 47 86 C8 61 }
        $shift1 = { C1 E0 04 }
        $shift2 = { C1 E8 05 }
        $round32 = { 20 00 00 00 }

    condition:
        uint16(0) == 0x5A4D and
        $delta and
        2 of ($shift*) and
        filesize < 2MB
}
This rule is moderately strong as it detects the method used to hide VirtualProtect. There's a possible chance to catch another version of this Stage 0 Payload. The biggest flaw with this rule is it is too broad and will cause tons of false positives.
rule LockBit_Black_IAT_Reconstruction
{
    meta:
        description = "Detects reordered character array import reconstruction"
        author = "VeryCuteLookingCat"
        confidence = "low"
        scope = "static"

    strings:
        $loadlib = "LoadLibraryA" ascii
        $getproc = "GetProcAddress" ascii
        $kernel  = "kernel32.dll" ascii

    condition:
        uint16(0) == 0x5A4D and
        $loadlib and $getproc and $kernel and
        not pe.imports("kernel32.dll", "VirtualProtect")
}
Enforcing ACG ( Arbitrary Code Guard ) will prevent the execution of most types of shellcode by blocking unsigned executable memory region allocation or tampering. Directly from the Microsoft documentation, "Arbitrary code guard protects an application from executing dynamically generated code (code that isn't loaded, for example, from the exe itself or a dll). Arbitrary code guard works by preventing memory from being marked as executable." This is the best solution provided that no JIT ( Just-In-Time ) compilers or applications are running as they will experience compatibility issues.
While this solution doesn't prevent allocation, It detects impossible situations. Each memory region has a set of behavior rules, and if these rules are violated then suspicion is raised. Using an industry-grade Endpoint Detection and Response System would reliably catch this payload. Why would it work? The payload creates and excessive amount of suspicious activity, allocating heap and marking it as RWX, executing that heap region, decoding large blobs of text from the binary and more would cause suspicion.
This payload is executed as shellcode but appears to be written in C and converted. The protections on this payload include string encryption and import hiding. The first thing this payload does is allocate heap with the size of 0x41002. This heap is used to store polymorphic shellcode that decrypts a pointer to the imports, passes in arguments, and returns requirements. Each shellcode stub is 0x10 bytes and has 5 total mutations. These mutations include XOR, ROT14 and arithmetic. The string encryption is a single function that loops through an array and xor's each value by 0x47063fc8 and uses the bitwise NOT operator. Some strings didn't decode to any ASCII characters and as such, will be replaced with question marks. The full list of strings can be accessed here.
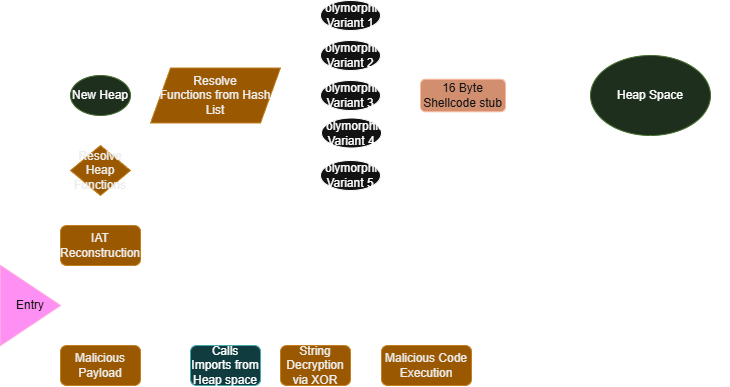
Made with drawio.
Stage 1 runs purely in memory as shellcode, bypassing traditional PE-based mitigations. Static scanning is ineffective due to:
- Polymorphic stubs for imports, breaking CFG reconstruction
- Encrypted strings and import hashing
- Heap-resident code and RWX allocations
Effective monitoring shifts from signature-based AV to behavioral detection:
- EDR style monitoring of anomalous memory regions and heap allocations
- Control Flow Guard to catch execution outside module bounds
- Arbitrary Code Guard to prevent execution of dynamically generated code
These characteristics explain why Stage 1 evades Stage 0-targeted mitigations and why defenders must correlate runtime memory behavior rather than rely purely on static signatures.