This project include Exploratory Data Analysis, Time Series Data Analysis, Forecasting, and Data Visualization for Retail Sales Data.
- Take a look on a dataset info and describe it
- Data Cleaning and Formatting (chceck null values and solve it, transform the data format)
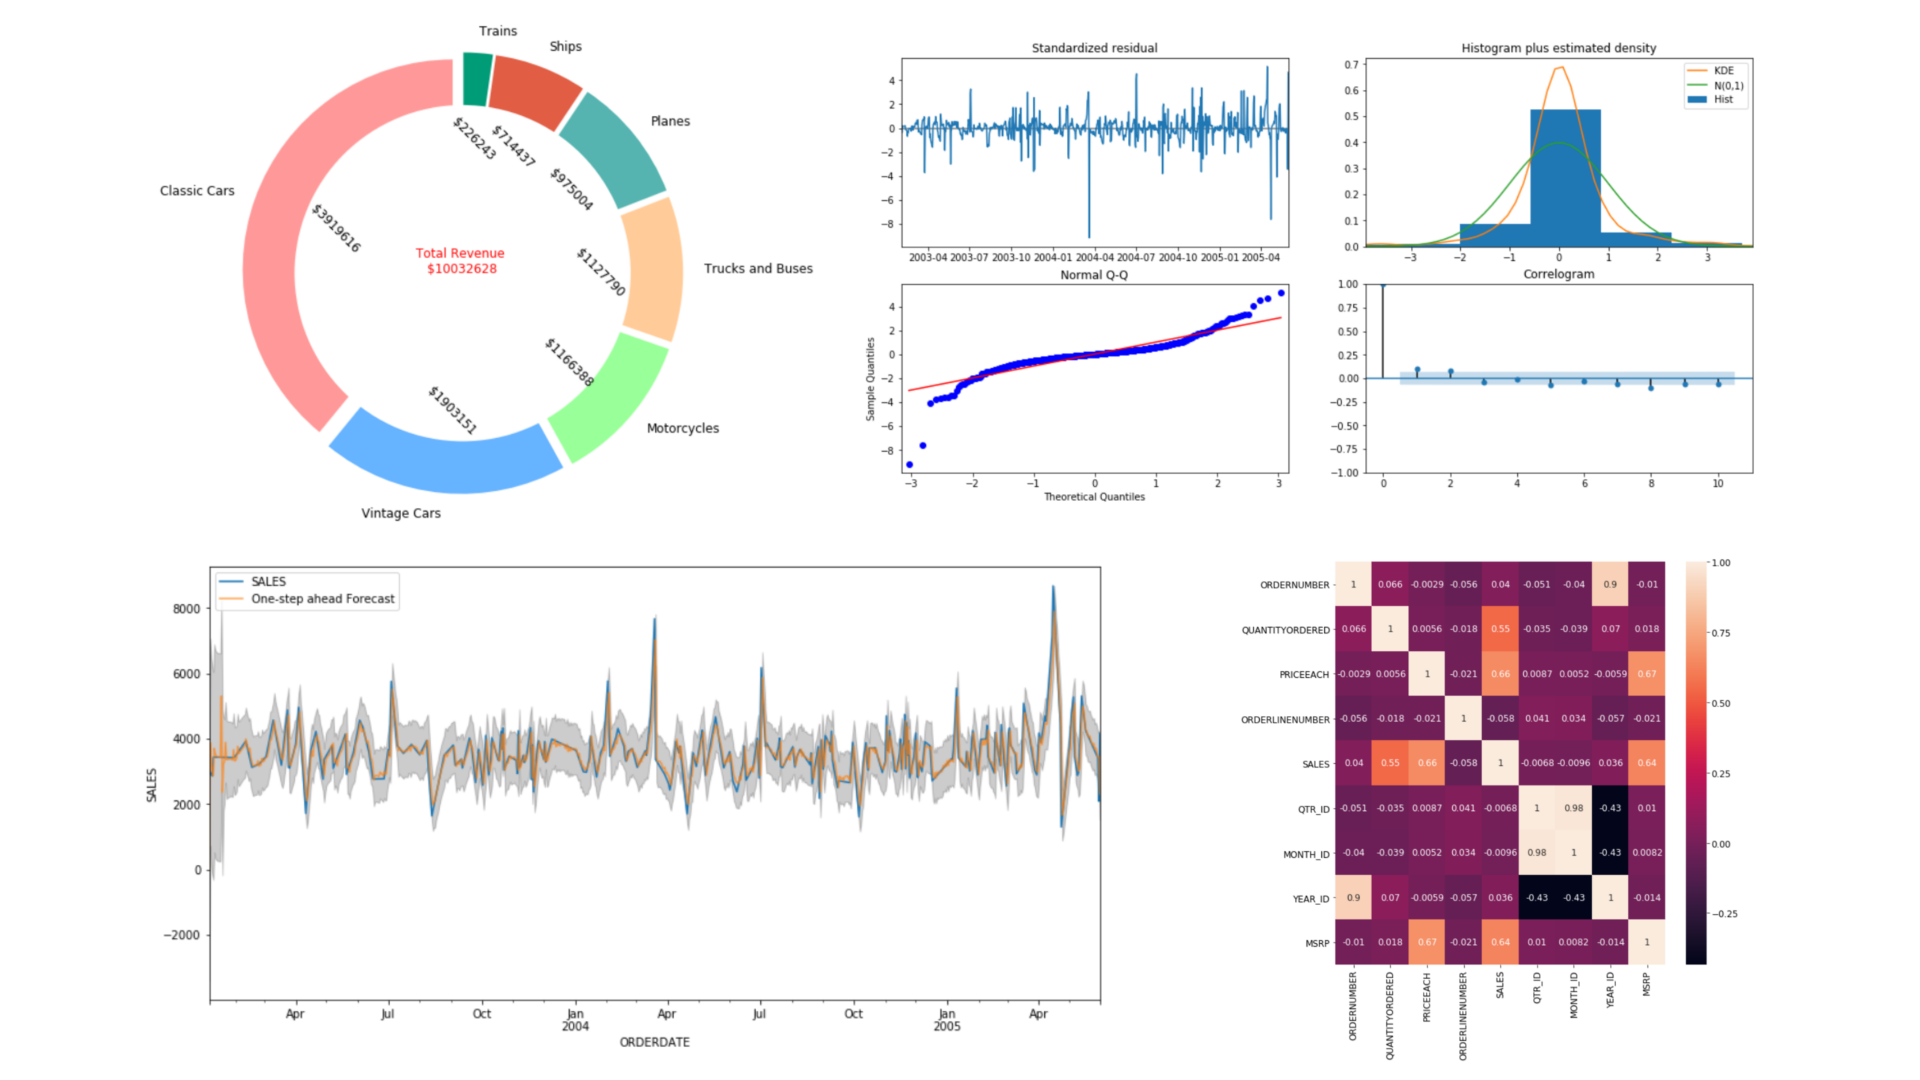
- Look for insight by create a Visualization from the data such as Most Valuable Customer, Highest Revenue by Country, City, and Product Line
- Do Statistical Analysis using Pearson Correlation
- Do observation to see the correlation
- Show the data distribution
- Plotting the data to understand the sales distribution
- Checking stationary using 2 methods (Comparing mean, variance, and Augmented Dicky Fuller Test)
- Decompose Time Series Data into Trend and Seasonality
- Training model using SARIMA (Seasonal Autoregressive Integrated Moving Average)
- Define and fitting the model
- Plotting the prediction and compare it with the real values
- Forecast the sales for 7 days