clump shapeevolution log
This log file follows the development made in the
shapeevolution-log.md file, where a track was
selected inside a range of frames, and its evolution was matched by
moving the boundary of the known frame knownfr to the position of the
unknown frame ukfr. From this point, the boundary was deformed to fit the
unknown frame.
First of all, determining a clump needs to be studied, can be selected by the
function searchClumpOnFrame.m. Once the clump has
been identified, the objective is to get the frames before the clump is formed,
where both participating cells are present, until the end of the life of the
clump.
Some clumps may disappear and reappear because
- the participating cells detached and then reattached into the clump.
- a new cell or clump attached to the current clump and then detached from it.
Either way, the objective of this frame range selection is to have the frame(s) leading up to a clump, and the first lifespan of the clump.
Places where the original phagosight implementation have caused something to
lose the segmentation labels on the images, and therefore no analysis can be
made on them. As a measure, they are being removed from the analysis, after
selecting the range. These are stored in file DATASETHOLES.mat:
DATASETHOLES = [75 119 161 180 195 302 520];The way to remove them from the analysis, after selecting the appropriate range of frames:
trackinfo(ismember(trackinfo.timeframe,DATASETHOLES),:) = [];Getting the exact lifespan of the clump.
z = unique(trackinfo.timeframe((trackinfo.clumpcode==wuc)));zini = [];
zfin = [];
for ix=1:length(clumplab)
testv = trackinfo.timeframe(trackinfo.finalLabel==clumplab(ix),:);
zini = [zini min(testv)];
zfin = [zfin max(testv)];
end
zini = max(zini);
zfin = min(zfin);- Parameters
- Initial point
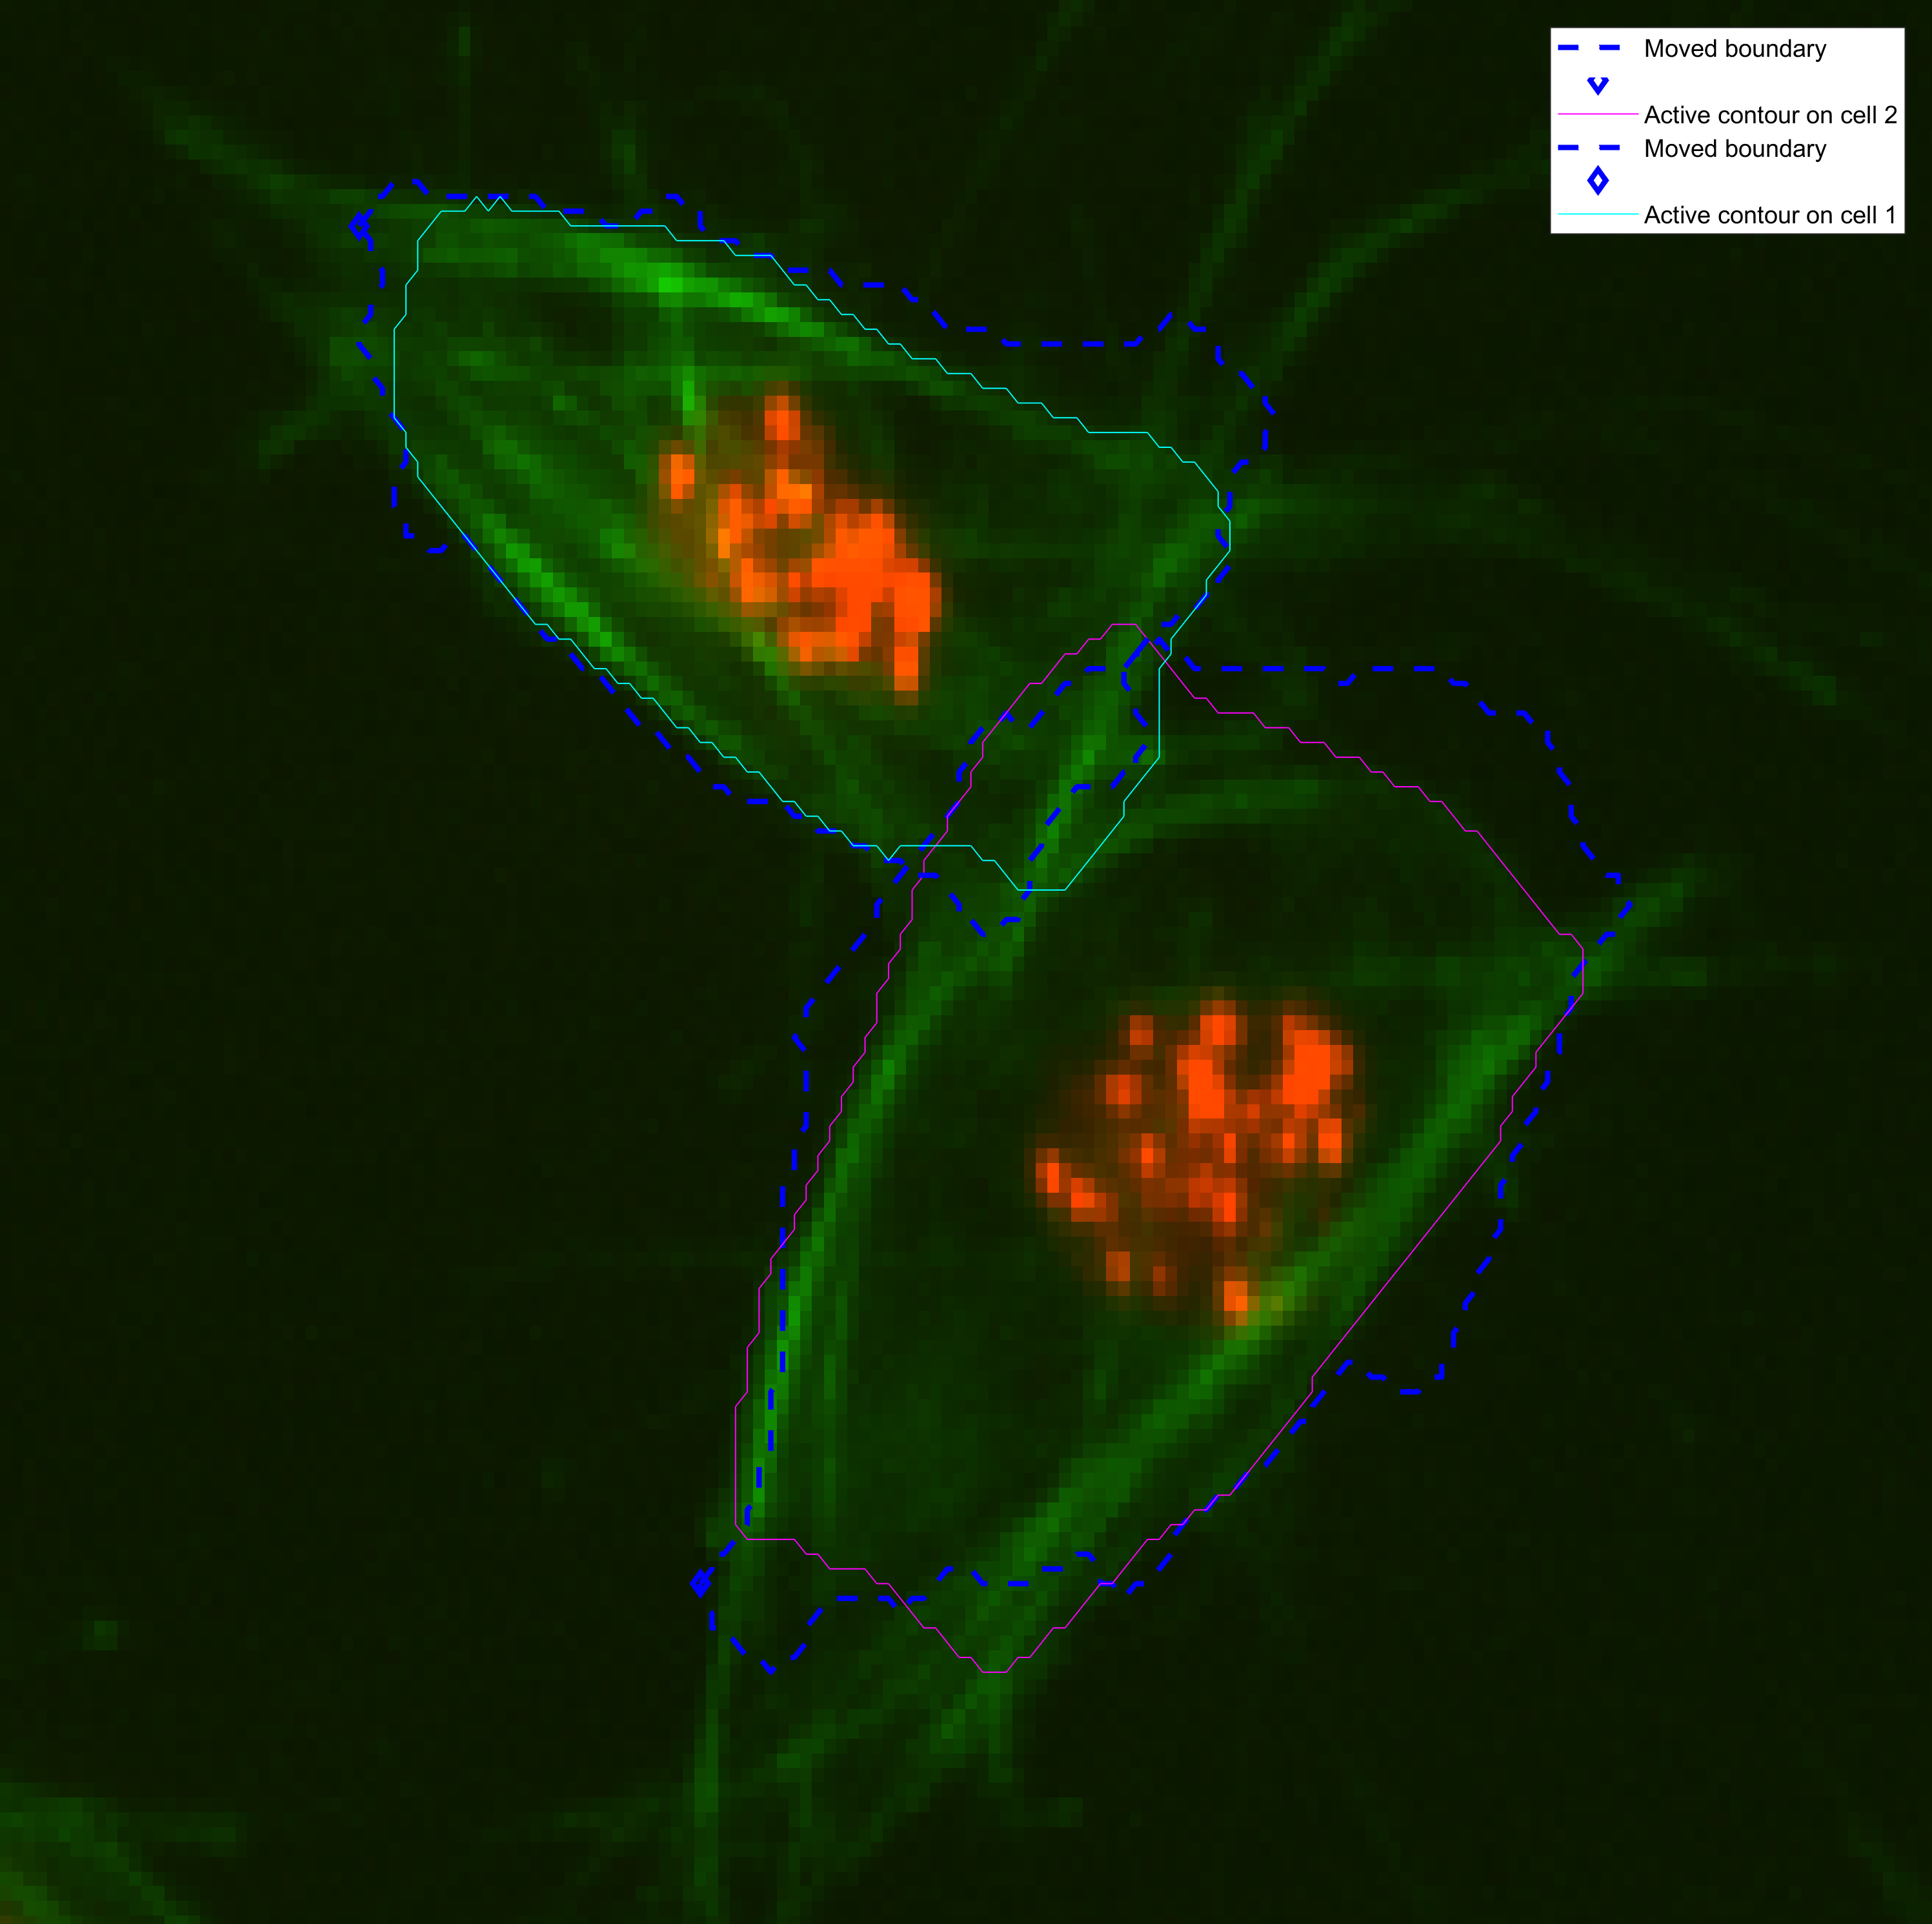
In this example, the known frame knownfr and the unknown frame ukfr
are 10 frames apart. The shapes in the known frames (dark blue) look
different, especially in the cell that is below. Therefore, the output
by the active contours is much worse in that cell (MAGENTA).
 The parameters of this experiment for both cell shapes are displayed in the
table below. Experimentation and tweaking of the method is ongoing.
The parameters of this experiment for both cell shapes are displayed in the
table below. Experimentation and tweaking of the method is ongoing.
| method | iter | smoothf | contractionbias |
|---|---|---|---|
| Chan-Vese | 100.00 | 2.00 | -0.1 |
An example of an easy clump
