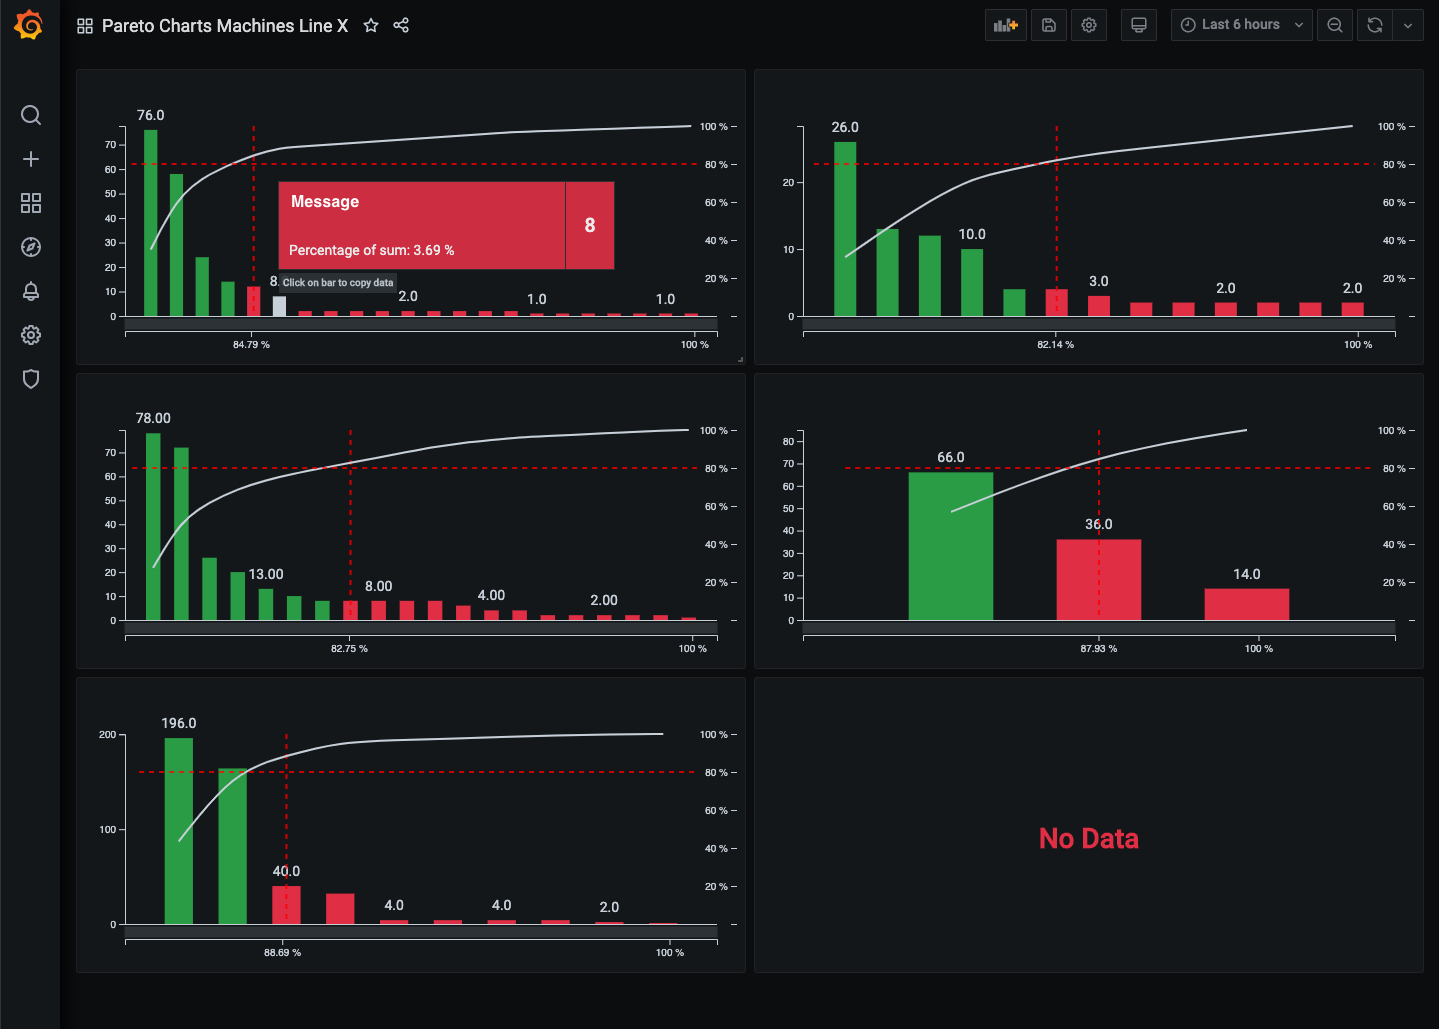
This plugin provides you the ability to draw a Pareto chart with RDB and TimeSeries databases.
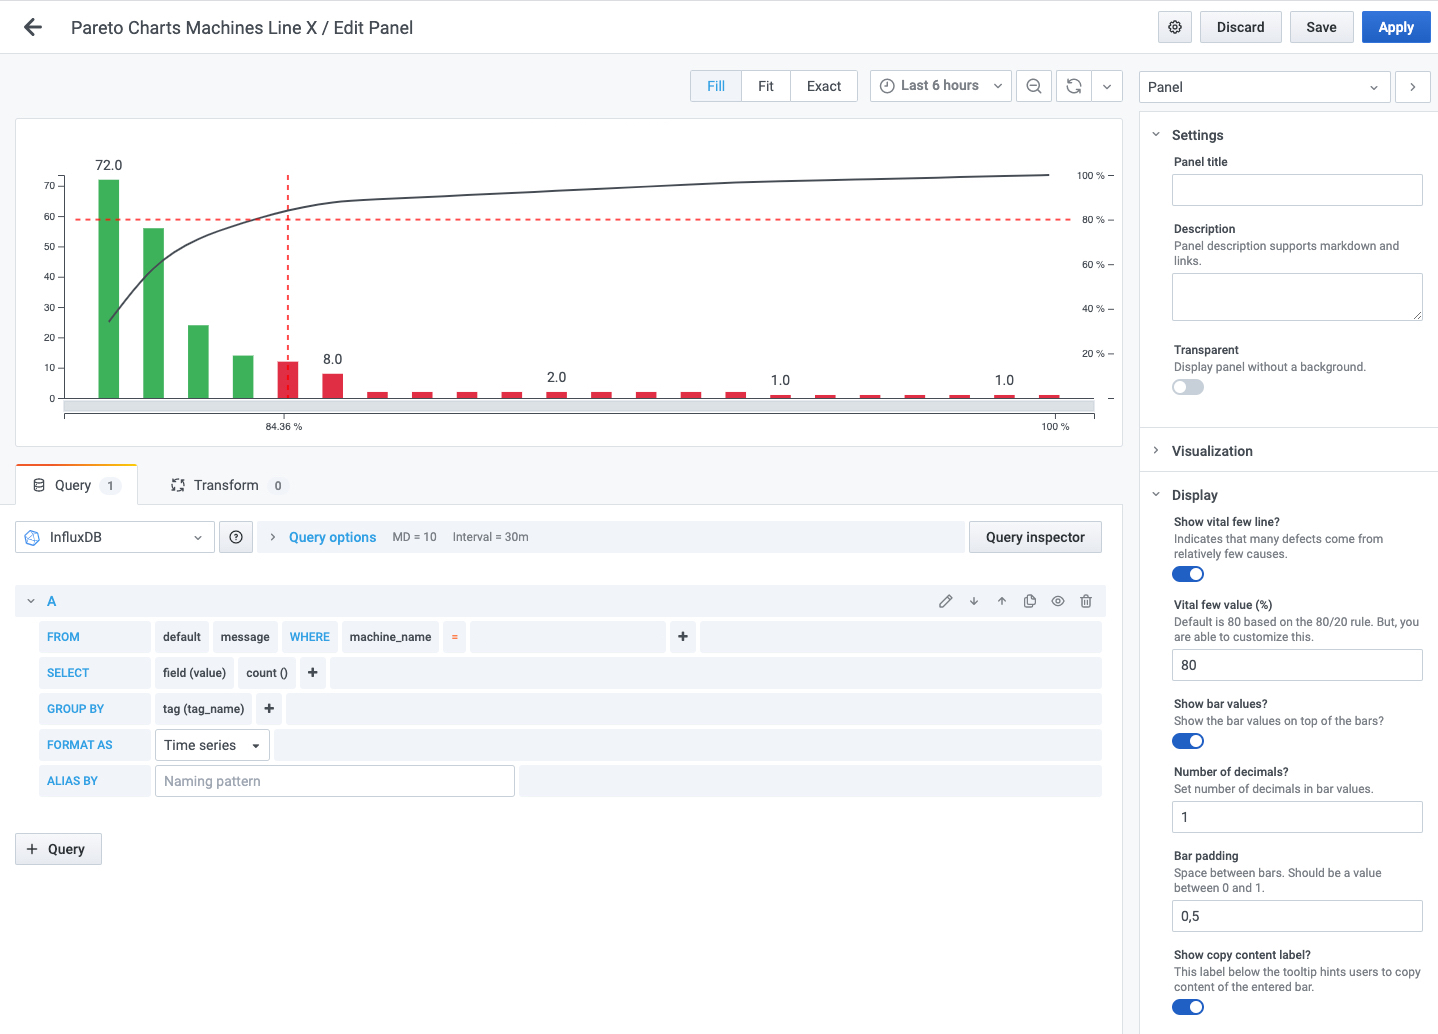
- Setting a custom background color to the tooltip overlay
- Configurable vital few and trivial many lines
- Pan and zoom for detailed info without changing date range
- Set decimals count on displayed values
- Specify bar spacing
- Quickly copy bar data to clipboard simply by clicking on the bar
- Option to show/hide bar values on default
- Style graphs to need
Provide the defects which could be "categories" (type string) for example and a frequency value cummulatives/counts (type number).
| Defects | Counts |
|---|---|
| Error 1 | 10 |
| Error 2 | 4 |
| Error 3 | 1 |
| ... | ... |
SELECT _label_, _count_, ...
FROM _table_