This project presents an interactive Power BI dashboard that analyzes the annual sales performance of electronic items. The report provides clear insights into sales trends, product-wise performance, regional distribution, and key business metrics through structured and interactive visualizations.
The repository is intended for data analysis demonstration, business intelligence practice, and portfolio presentation.
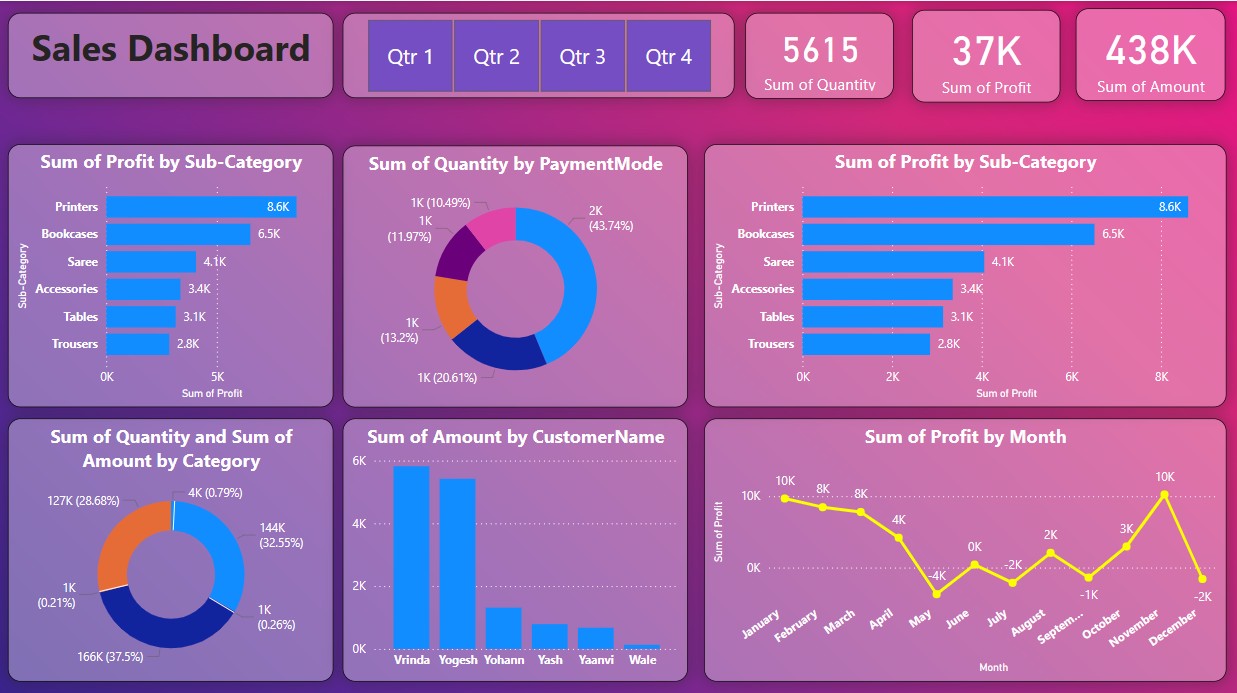
The Annual Sales Report for Electronic Items analyzes historical sales data to help understand overall business performance. Using Power BI, the project transforms raw sales data into meaningful insights that support data-driven decision-making.
The dashboard allows users to explore trends, compare categories, and evaluate performance across regions and time periods.
- Annual sales overview
- Product category breakdown (TVs, Laptops, Mobiles, and others)
- Region-wise and store-wise sales performance
- Monthly sales trends and comparisons
- Revenue, units sold, and profitability insights
- Interactive filters and drill-down capabilities
- Power BI Desktop
- Data modeling
- DAX measures
- Visual analytics
Annual-Sales-Report-for-Electronic-Items/
├── sales report.pbix # Power BI report file
└── README.md # Project documentation
- Download or clone the repository:
git clone https://github.com/mdasharaf07/Annual-Sales-Report-for-Electronic-Items.git
- Open the
sales report.pbixfile using Power BI Desktop. - Explore the dashboard using slicers, filters, and visuals.
- Modify or extend the report using your own dataset if required.
- Business intelligence and data visualization practice
- Demonstration of Power BI reporting skills
- Academic or portfolio project
- Exploratory sales data analysis
- Uses static data included in the Power BI file
- Does not connect to a live or real-time data source
- Business insights are limited to the available dataset
- Connect the dashboard to a live database or Excel source
- Add forecasting and trend prediction using Power BI AI visuals
- Publish and embed the dashboard in a website or SharePoint
- Enhance interactivity with advanced DAX measures
Maintained by Mohamed Asharaf.