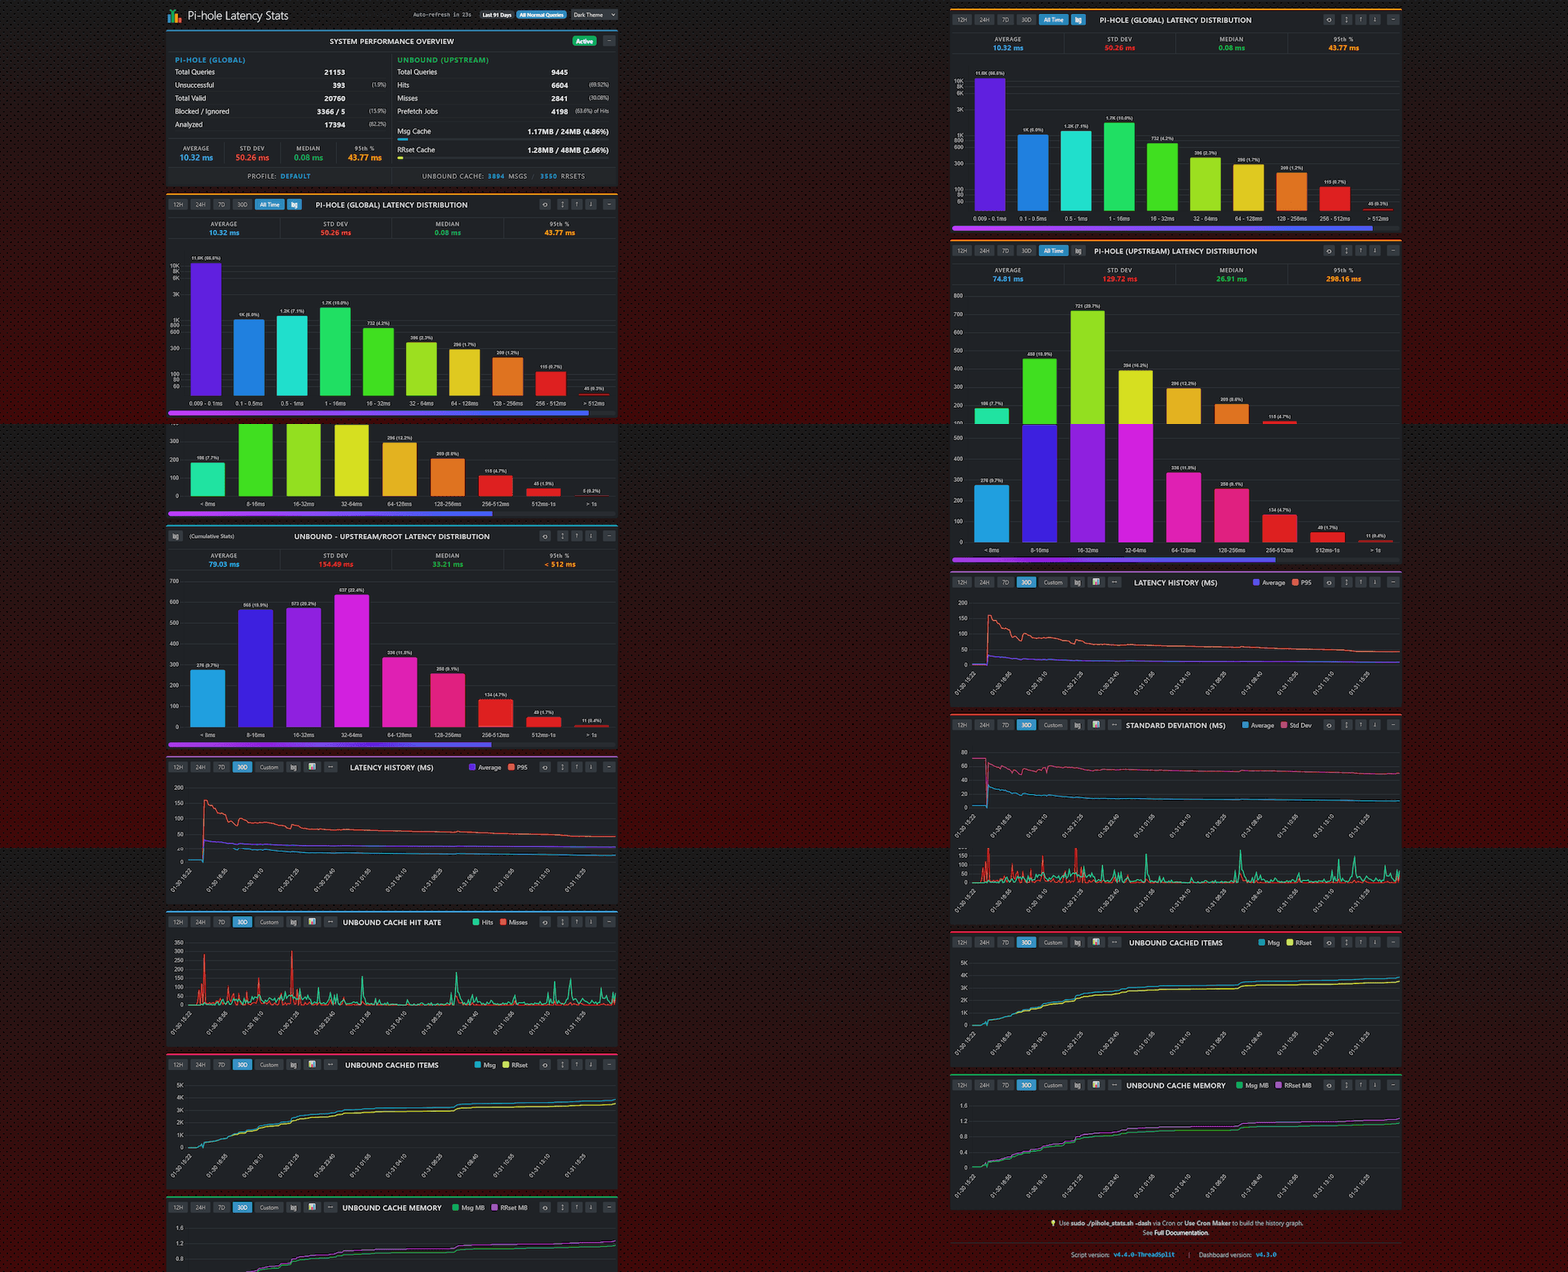
Pi-hole Latency Stats is a lightweight, zero-dependency Bash script that analyzes your Pi-hole's performance. It calculates latency percentiles (Median, 95th), groups query speeds into "Tiers" (buckets), monitors your Unbound recursive DNS server, and presents everything in a modern, responsive web dashboard.
This tool helps you answer: "Is my DNS slow because of my upstream provider, or is it just my local network?" and "Is Unbound performing efficiently?"
🔍 Latency Analysis Calculates Average, Median, and P95 latency to spot jitters.
📈 Tiered Grouping Groups query speeds into "Tiers" (e.g., <10ms, 10-50ms) for easy analysis.
🔄 Unbound Integration Auto-detects Unbound to report Cache Hit Ratio, Prefetching, and RAM Usage.
📸 Snapshot Mode Safely copies the database before analysis to prevent Database Locked errors.
🎯 Smart Filtering Filter by Time (24h, 7d), Status (Blocked/Forwarded), or Domain (Wildcards supported).
🤖 Automation Ready Native JSON output for Home Assistant, Grafana, or Node-RED integration.
sqlite3httpd- (Optional)
unboundandunbound-host(for Unbound statistics)
To install the core script, the web dashboard, and all required dependencies, run:
curl -fL -o install_phls.sh https://github.com/panoc/pihole-latency-stats/releases/latest/download/install_phls.sh && sudo bash install_phls.sh
Includes a modern, responsive browser dashboard powered by Chart.js.
Features: Auto-refresh, Dark Mode, Historical Trends, and Multi-Profile support.

Speed tests measure bandwidth, not latency. DNS lag is the primary cause of sluggish browsing.
- The Test: Compare your Local speed vs Upstream speed.
./pihole_stats.sh -pi(Cached/Local answers)./pihole_stats.sh -up(Cloudflare/Google/ISP answers)
💡 The Insight
- If
-piis slow (> 10ms): Your Raspberry Pi might be overloaded or using a slow SD card.- If
-upis slow (> 100ms): Your ISP or upstream DNS provider is having issues.
If you run Unbound as a recursive resolver, blind trust isn't enough. Verify your efficiency.
- The Strategy: Run
./pihole_stats.sh -upto strictly analyze upstream resolution speed. Compare the Average against a standard forwarder (like1.1.1.1). - Deep Inspection: Use the
-uccflag to count the exact number of Messages and RRsets in RAM.
💡 The Insight If your Cache Hit Ratio stays low (< 50%) after 24 hours, consider increasing
cache-min-ttlin your Unbound config.
Services like work VPNs or streaming sites often behave differently than general traffic.
- The Test: Filter stats for specific domains.
./pihole_stats.sh -dm "netflix"(Matchesnetflix.com,nflxso.net, etc.)./pihole_stats.sh -edm "my-work-vpn.com"(Exact match only)
💡 The Insight You might find that while your global average is 20ms, specific queries are hitting Tier 8 (>1000ms), indicating a routing timeout.
Spot trends before they become problems by automating data collection.
-
The Setup: Add the script to Cron to run nightly.
-
./pihole_stats.sh -24h -j -f "daily_stats.json" -rt 30 -
The Insight:
- JSON Output: Ingest this into Home Assistant, Grafana, or Node-RED to visualize latency over weeks.
- Auto-Retention (
-rt): Keeps your disk clean by automatically deleting reports older than 30 days.
Detailed information on CLI flags, automation, and advanced tuning can be found here:


