Skip to content

Setup of samuelebistoletti/docker-statsd-influxdb-grafana:latest for DataDog tagged stats

Notifications You must be signed in to change notification settings

pervage/docker-statsd-influxdb-grafana-cci


Folders and files

NameName
Last commit message
Last commit date

Latest commit


History

7 Commits


Repository files navigation

docker-statsd-influxdb-grafana-cci

CircleCI CircleCI Workflow DockerHub

Setup of samuelebistoletti/docker-statsd-influxdb-grafana:latest for DataDog tagged stats

See here for Samuele Bistoletti's excellent github repo for this, or here for his docker hub.

Suggested Setup in docker-compose:

  dsig-statsd:
    image: mannimal/dsig-cci
    ports:
      - '3003:3003'
      - '3004:8083'
      - '8086:8086'
      - '22022:22'
      - '8125:8125/udp'

Copied Almost Verbatim from Samuele Bistoletti's README


Getting Started

If using docker-compose, follow the standard workflow of docker-compose up -d --build etc.

Once your container is up and running, send a few DataDog tagged stats to it and follow the instructions below!

Grafana

Open http://localhost:3003

Username: root
Password: root

Add data source on Grafana

  1. Using the wizard click on Add data source
  2. Choose a name for the source and flag it as Default
  3. Choose InfluxDB as type
  4. Choose direct as access
  5. Fill remaining fields as follows and click on Add without altering other fields
Url: http://localhost:8086
Database:	telegraf
User: telegraf
Password:	telegraf

Add a Dashboard/Graph

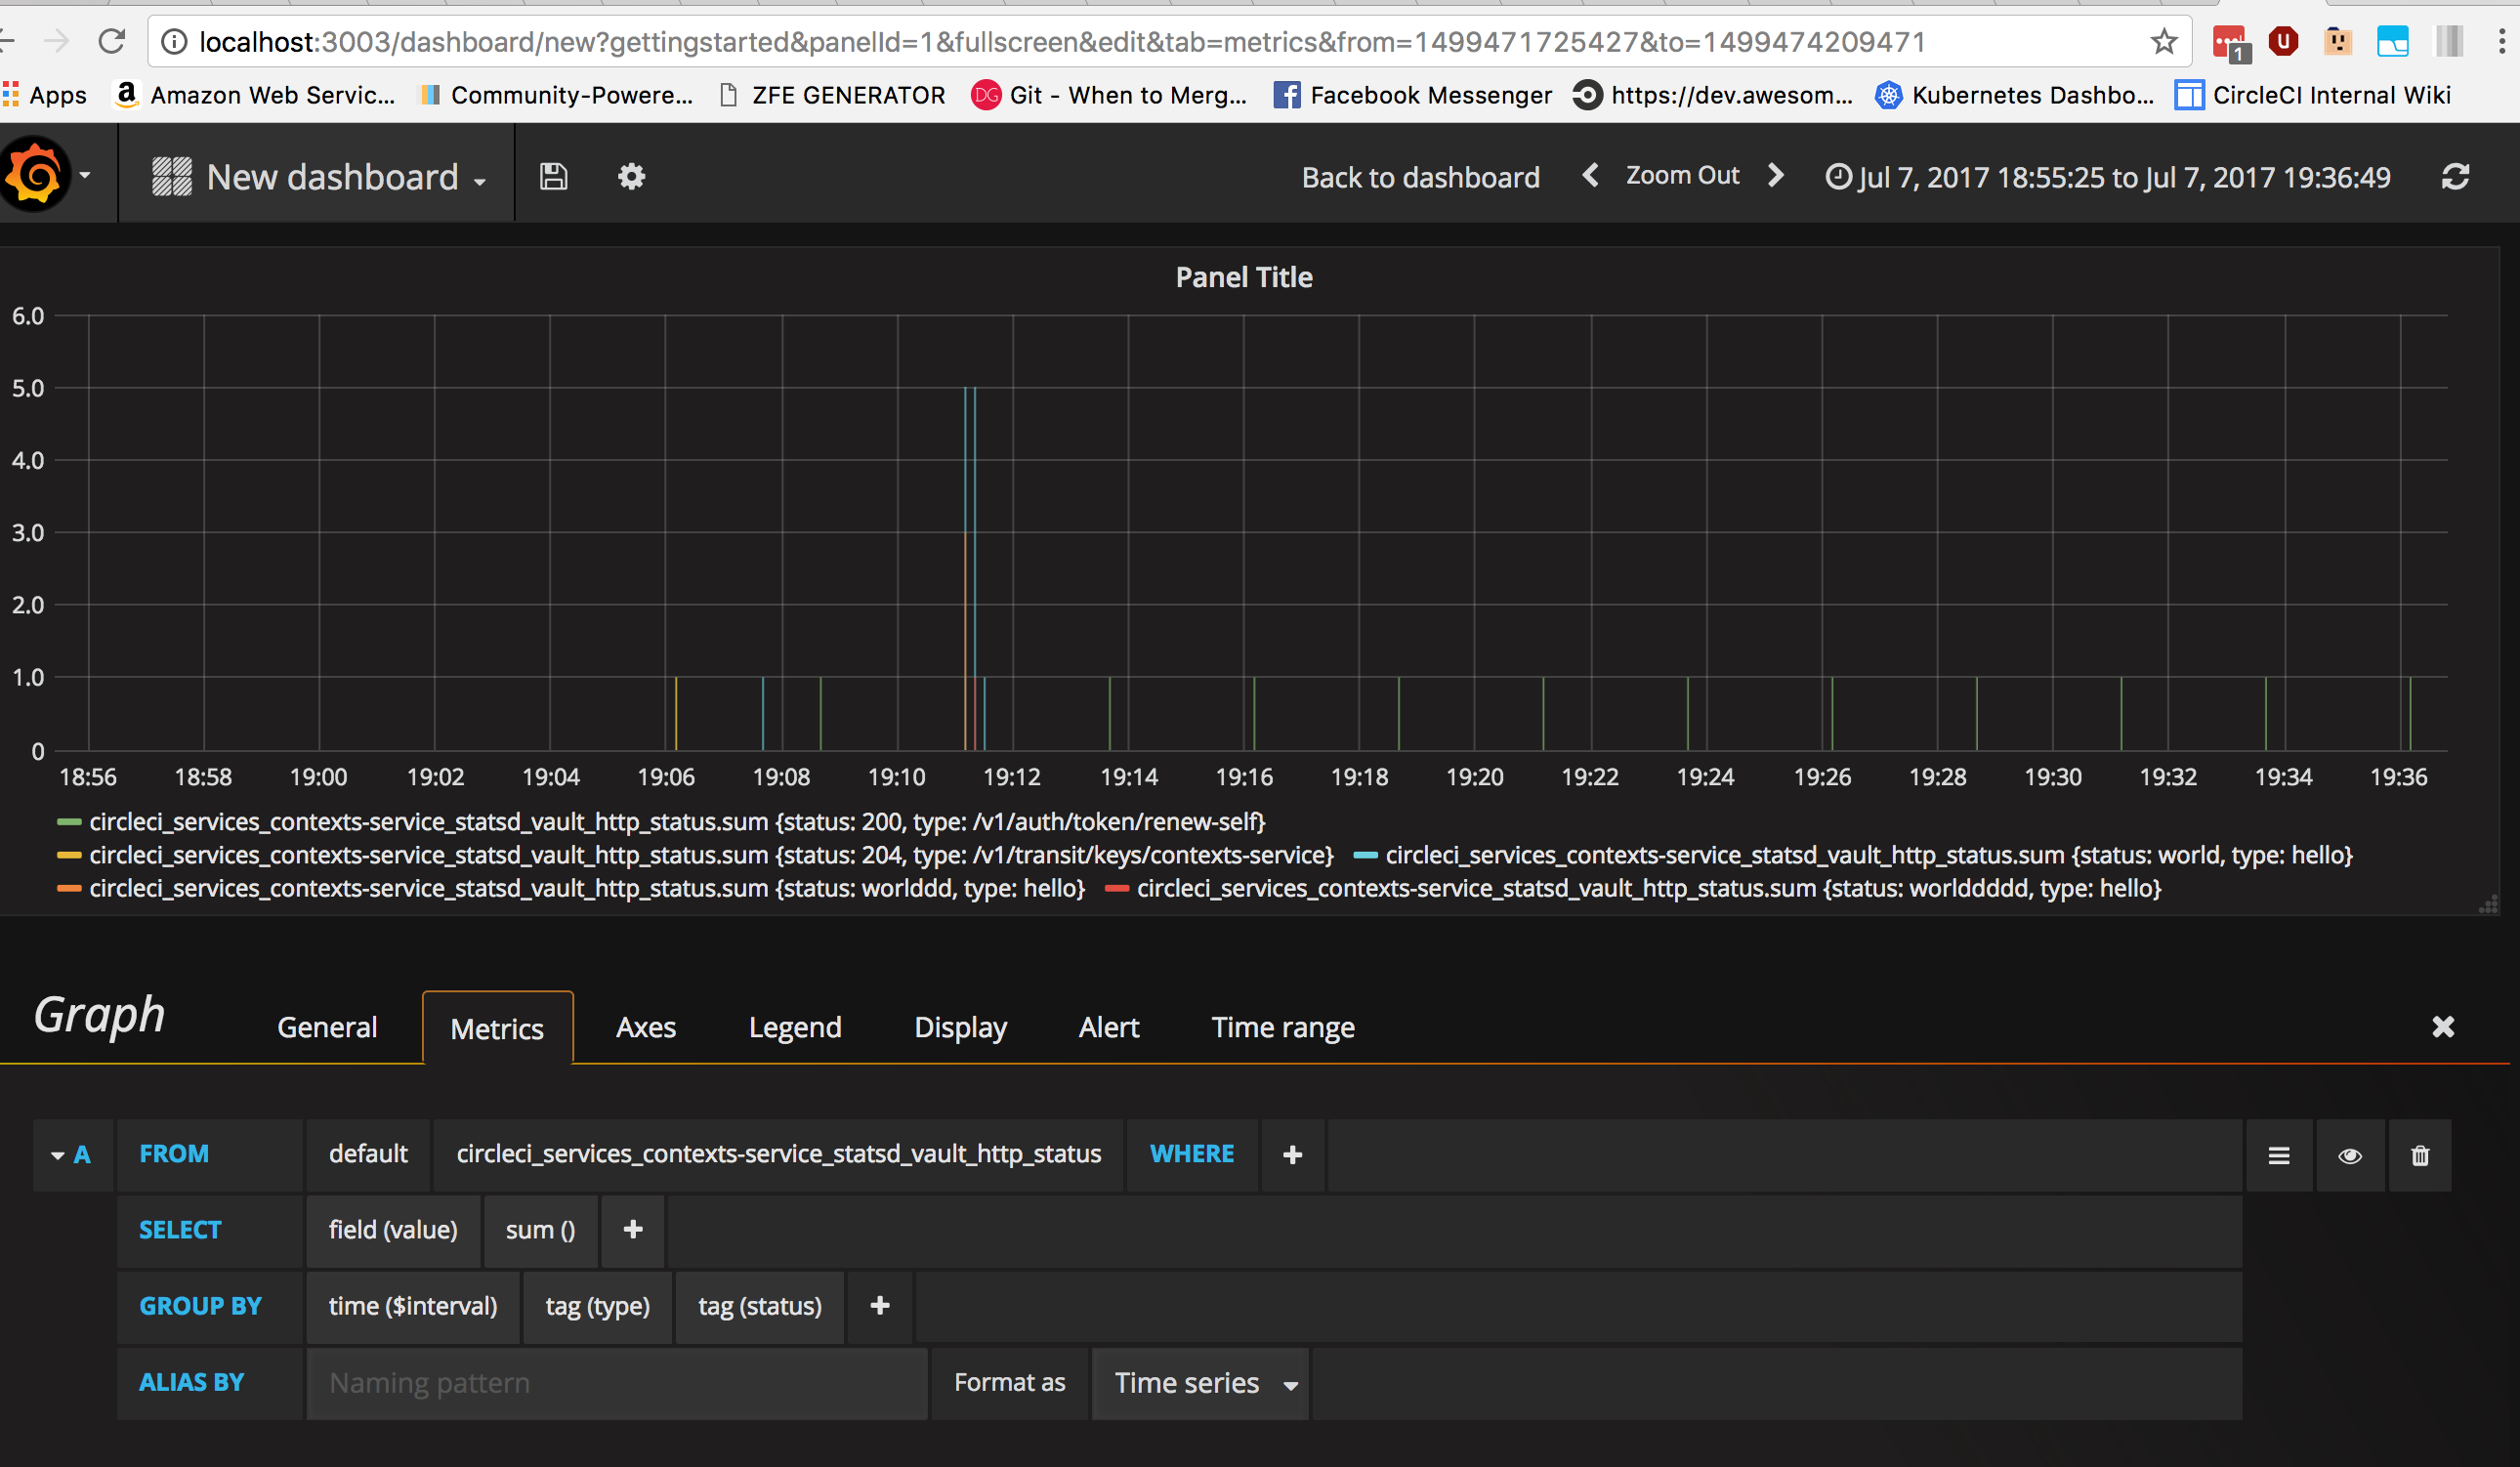
You can now start exploring the values capture by Telegraf in Grafana by creating a dashboard, and a graph!

screen shot 2017-07-07 at 19 37 39

About

Setup of samuelebistoletti/docker-statsd-influxdb-grafana:latest for DataDog tagged stats

Resources

Stars

Watchers

Forks

Releases

No releases published

Packages

No packages published